
A page can load quickly and still frustrate visitors. The three Core Web Vitals measure loading performance with Largest Contentful Paint (LCP), responsiveness with Interaction to Next Paint (INP), and visual stability with Cumulative Layout Shift (CLS). A practical core web vitals optimization guide targets an LCP of 2.5 seconds or less, an INP below 200 milliseconds, and a CLS score below 0.1.
Those thresholds turn a vague “my site feels slow” concern into specific issues to investigate. Speed matters, but responsiveness and unexpected page movement can disrupt the experience even after content appears. Improving these signals can make important pages smoother and easier to use.
This guide explains what each metric measures, how layout shifts and delayed interactions affect visitors, and how image delivery influences loading performance. It also covers Core Web Vitals in Google Search, where they are one consideration among several, and the optimization work that can address underlying problems.
Key Takeaways
- Understand how loading, responsiveness, and visual stability are measured, and what good performance looks like for each metric.
- Spot common causes of layout shifts, including animations and transitions, and learn how to keep page elements stable as content loads.
- See why Interaction to Next Paint replaced First Input Delay and what the change means for assessing real interactions.
- Explore how image formats, sizing, and delivery affect loading speed, especially when an image is the page’s largest visible element.
- Learn how real-user data and performance dashboards help connect Core Web Vitals improvements with page experience in Google Search.
Cumulative Layout Shift (CLS) – What is CLS?
Cumulative Layout Shift (CLS) measures unexpected movement of page elements during loading and use. Aim for a CLS score below 0.1; scores from 0.1 to 0.25 need improvement, while scores above 0.25 are poor.
Animation and Transition Layout Shifts
Animation-related layout shifts happen when motion changes an element’s position or size and pushes other content around. They matter because a moving page can make visitors lose their place or click the wrong control. Layout shifts caused by animated or transitioned CSS properties affect CLS when they occur more than 500 milliseconds after a user interaction.
Choose animations that don’t change the page’s layout, such as transforms and opacity changes, instead of properties that reposition nearby elements. Pages that animate CSS properties capable of affecting layout are 15% less likely to have good CLS than pages overall. Pages animating margin or border widths have poor CLS at almost twice the rate of pages overall.
Font Loading and Layout Stability
Font loading can shift a layout if the browser first displays fallback text, then replaces it with a custom font whose characters occupy different space. That change can alter line breaks and move headings, paragraphs, and buttons. For example, a heading that wraps onto an extra line after a font swap can push the content below it down.
Use the CSS property font-display: swap; to show fallback text while a custom font loads. Check how the chosen font affects line length and wrapping so you can reserve enough space for text. Preloading critical fonts can prioritize assets essential to the page layout and help reduce movement during loading.
Cumulative Layout Shift Optimization
CLS optimization means finding unexpected movement and reducing it without hiding or delaying useful content. Start with a performance report to identify affected pages and elements, then reproduce the movement during loading. For example, an image without reserved space may push a paragraph down when it appears.
Fix the cause at the element level. Specify image and video width and height attributes so the browser can reserve space before those assets load. Positioning ads lower on a page can reduce instability caused by ads above the fold. Preload critical images and fonts when they are essential to the initial layout.
- Reserve space for images and videos with explicit dimensions.
- Keep animated effects from changing surrounding layout.
- Review font swaps, ads, and other late-loading elements in the report.
Check visual stability across the page, not only on first display. A change to one element can affect nearby content, so compare the layout before and after loading. Prioritize shifts that obstruct reading or controls, then validate the updated page in the report.
What are the three Core Web Vitals metrics?
Core Web Vitals measure real-world loading performance, responsiveness, and visual stability. Largest Contentful Paint (LCP) tracks loading, Interaction to Next Paint (INP) evaluates responsiveness, and Cumulative Layout Shift (CLS) captures unexpected movement. Good targets are LCP within 2.5 seconds, INP below 200 milliseconds, and CLS below 0.1. A core web vitals optimization guide can help connect each metric to the page experience it represents.
To measure Core Web Vitals, open the report in Google Search Console to review groups of pages. Use PageSpeed Insights for page-level results and Chrome DevTools’ Performance panel to inspect a browser session. Search Console and Chrome User Experience Report data reflect real-world Chrome user experiences, while DevTools helps investigate issues in a controlled test.
The three metrics reveal different bottlenecks. A simple page may display its main content slowly if the server responds late. A page can load quickly yet feel unresponsive when JavaScript blocks the browser’s main thread. Or the layout can shift after loading, disrupting reading or interaction.
Google evaluates field performance at the 75th percentile of user experiences. That means the report reflects the slower end of real visits, not only a developer’s fastest test. The Chrome User Experience Report uses anonymized data collected from Chrome users, helping distinguish a lab-only issue from a problem visitors encounter across devices and network conditions.
PageSpeed Insights helps connect results to possible causes. Compare field data with lab diagnostics: field data reflects user experience, while a lab test provides a repeatable view of a page load. Test important templates, such as a product page and a lead form, because each may have different bottlenecks.
Performance dashboards are most useful when they track trends alongside affected page groups. In Search Console, check whether issues cluster around a template or URL type, then compare later reports after making changes. One test cannot show whether a fix improved the experience for real users.
Page builders and plugins can add scripts, styles, and requests that compete for browser time. On WordPress, review active plugins and remove unused features or scripts where safe. If TTFB stays above 400 milliseconds, address hosting before relying on frontend changes to improve LCP; a good TTFB target is below 0.8 seconds.
Shared WordPress hosting typically has a TTFB of 500 to 1500 milliseconds, compared with 100 to 300 milliseconds for managed WordPress hosting. Caching can reduce repeated server work, while a content delivery network can deliver assets to users in different locations. When template changes are needed, website development and landing page work can address the page structure behind recurring performance problems.
Interaction to Next Paint (INP): What Is It?
Interaction to Next Paint (INP) measures how quickly a page responds throughout a visitor’s interactions. A good INP is below 200 milliseconds; a score from 200 to 500 milliseconds needs improvement, and above 500 milliseconds is poor. Unlike a metric focused on one input, INP reflects the delay from interaction through the browser’s next visual update.
Google replaced First Input Delay (FID) with INP in March 2024. FID measured only the delay before a browser began processing a visitor’s first input. It did not account for later interactions or the time needed to process an event and render its visual response. INP provides a broader view by considering interactions such as clicking a menu, typing into a search field, or adding an item to a cart.
Consider a visitor selecting a filter. The browser may receive the click promptly, but a long JavaScript task can delay the filtered results appearing. INP includes that wait for the next paint. A page’s INP is 500 milliseconds if its slowest interaction takes half a second to process. This helps identify sluggish controls that a fast initial page display can conceal.
Start diagnosis by reproducing the slow interaction, then inspect the page’s main-thread work in Chrome DevTools. Browser tasks lasting more than 50 milliseconds are considered long tasks and can block responses to user actions. Look for expensive event handlers, repeated layout calculations, and scripts that run during the interaction. Break lengthy JavaScript work into smaller tasks, remove unnecessary processing, and avoid updating large sections of the page when one element changes.
Third-party scripts can compete for processing time. Review analytics, chat widgets, and advertising scripts, then load them asynchronously or limit their use where possible. For example, avoid recalculating search results on every keystroke if the interface can wait until typing pauses. Keep the response clear, such as by showing a loading state while results render.
Use real-user monitoring and the Core Web Vitals report in Search Console to identify patterns across page groups. Lab testing can help reproduce an interaction, while field data shows how visitors experience it across devices and network conditions. Prioritize the slowest meaningful interactions, then compare measurements after each code change.
Preloading helps with resources needed early, but it does not directly fix every INP problem. Prioritizing a critical script can help it arrive sooner, but competing resources can still delay interaction processing. Distinguish loading delays from JavaScript execution issues, then address the bottleneck affecting the visitor’s next action.
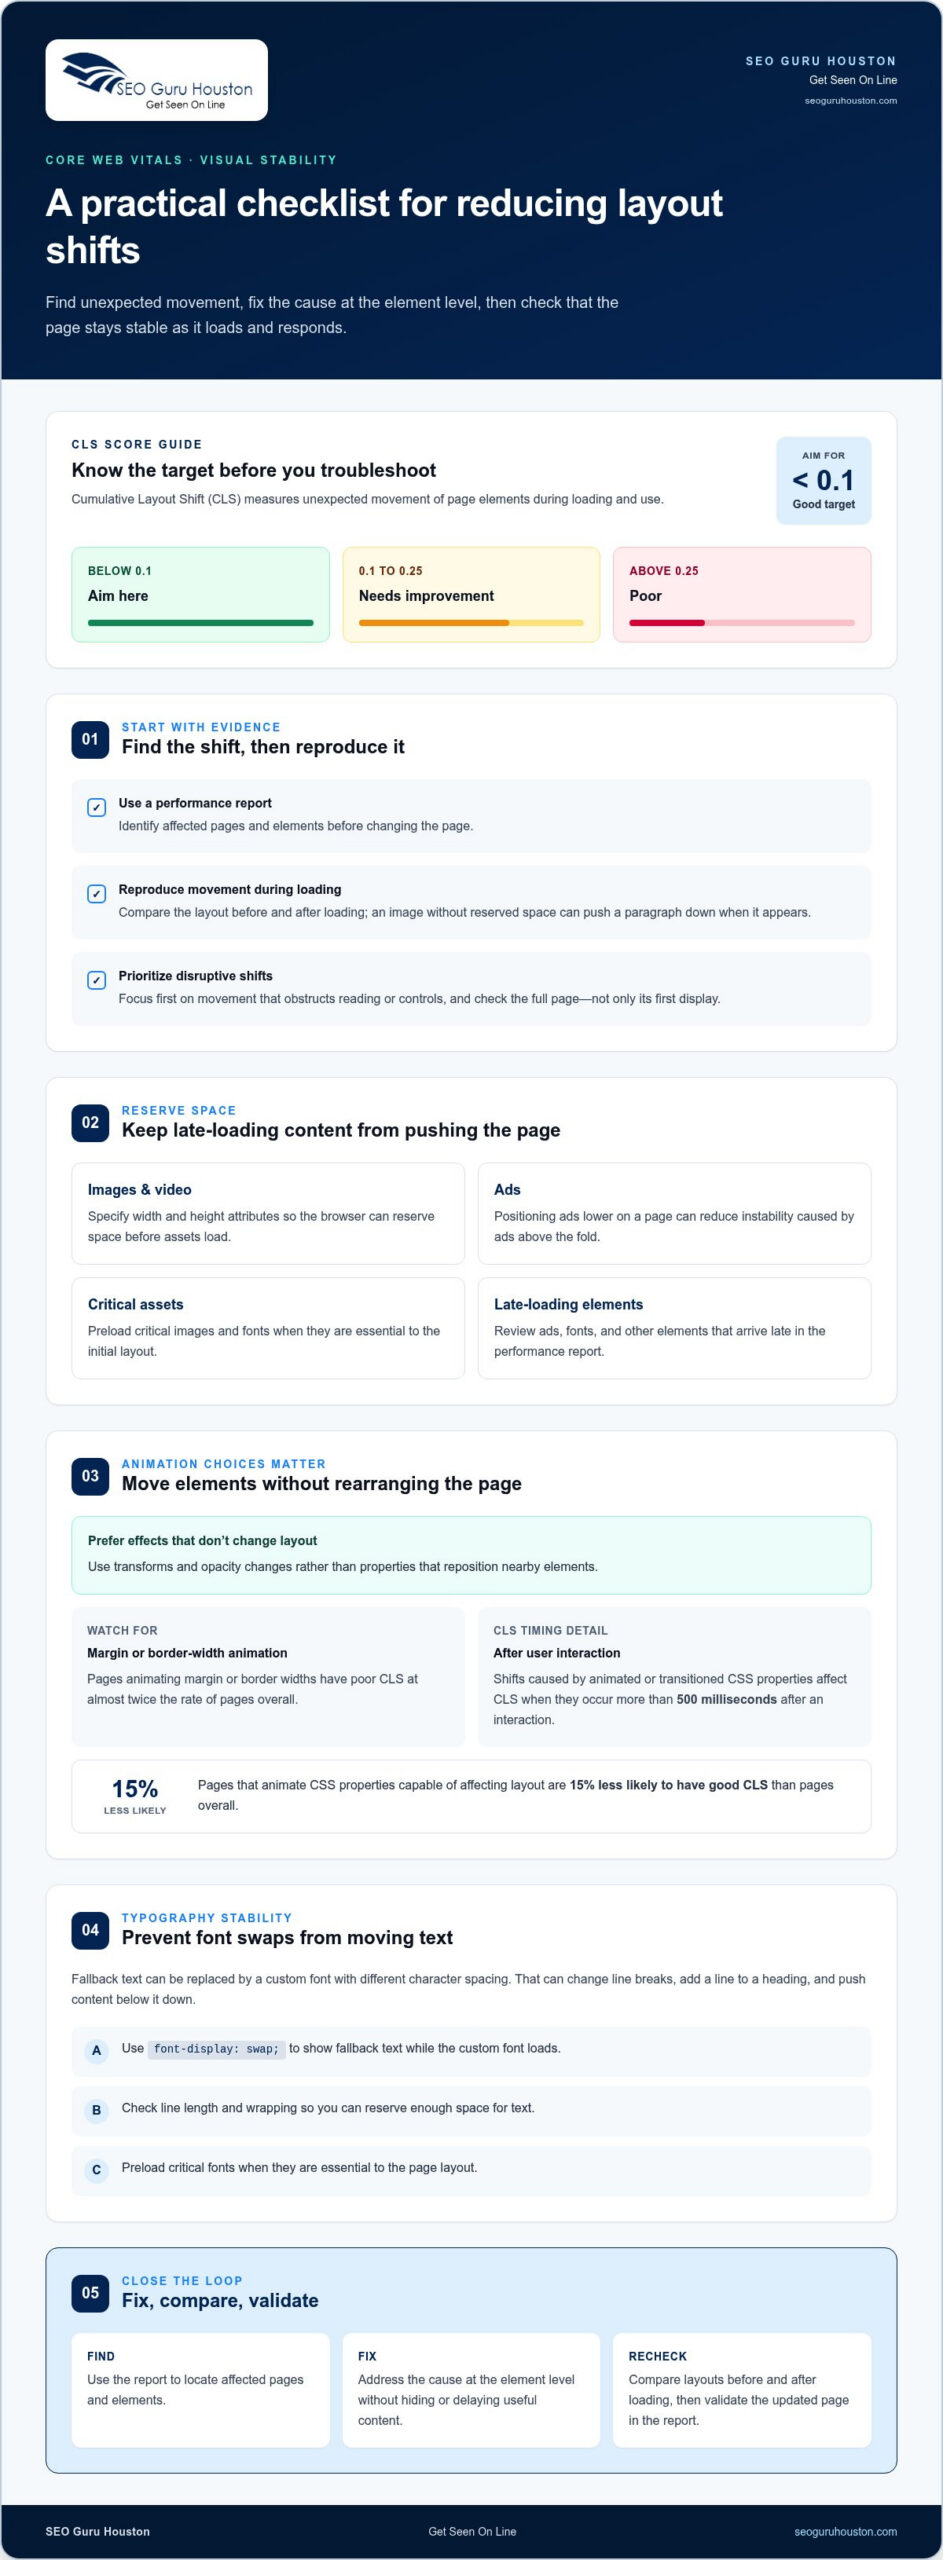
Image format and responsive image optimization
For mobile users, prioritize the image that becomes the largest contentful paint element, then reduce its file size and loading delay. Serve appropriately sized images, use modern formats such as WebP, and lazy-load images outside the viewport while ensuring the primary visual is discoverable early.
Images often determine whether a mobile page feels ready. The 2024 Web Almanac reports that 73% of mobile pages have an image as their LCP element. Compress large files and serve WebP where appropriate; WebP media content is 34% smaller than the usual format. Match each image’s dimensions to its display size instead of sending a large desktop asset to a narrow screen.
Responsive image markup lets the browser choose a suitable source for the screen and layout. Use srcset to offer image variants and sizes to describe their expected display width. For example, a phone showing a small product thumbnail shouldn’t download the oversized file used for a full-width desktop banner. This reduces unnecessary data transfer.
Make the LCP image easy for the browser to discover in the initial HTML. Among pages whose LCP element was an image, 35% had image source URLs that weren’t discoverable in the initial HTML response. A further 7% obscured the LCP image behind a data-src attribute. Avoid hiding the primary image behind JavaScript-driven loading when it needs to appear early.
Prioritize images larger than 10,000 square pixels when investigating LCP. Use image preloading selectively for a critical, immediately visible visual, so the browser can request it sooner. Don’t preload every image: unnecessary requests compete for network capacity and can delay the resource that matters most.
Reserve layout space by setting image dimensions, then lazy-load below-the-fold images. Sixty-six percent of pages have at least one image without an explicit size, which can leave the browser unable to allocate space before loading. WordPress has supported native WebP images since version 5.8, and native lazy loading since version 5.5.
Image optimization is only part of resource optimization. Render-blocking CSS can delay the first display, while large JavaScript bundles and third-party scripts compete for browser time. Minify CSS and JavaScript, defer noncritical resources, and load below-the-fold images as they approach the viewport.
- Compress images and select responsive variants for mobile display.
- Keep the LCP image visible in initial HTML and prioritize it selectively.
- Reserve image space and lazy-load visuals outside the viewport.
A content delivery network can serve image assets quickly to users in different locations. After changing formats, markup, or delivery, compare mobile field performance and inspect the LCP element again. This helps show whether the image itself, its discovery, or another resource is still delaying the visual result in Google Search.
Core Web Vitals and page experience in Google Search
The practical targets help teams decide what to fix. Aim for Largest Contentful Paint within 2.5 seconds, Interaction to Next Paint below 200 milliseconds, and Cumulative Layout Shift below 0.1. Google assesses user experiences at the 75th percentile, so a page’s fastest visit does not represent every visitor. A page that performs well only on a developer’s laptop may still struggle on slower mobile networks.
Use that percentile perspective to prioritize pages and templates. If a Search Console report groups URLs with similar performance, investigate their shared layout or components first. For example, a slow product template may affect many product pages; fixing shared image handling or scripts can address a pattern rather than one URL. Reassess field data after changes because real-world results reflect users’ devices and connections.
Keep the metrics in context. A good LCP score means the largest visible content appeared promptly; it does not prove every form or menu responds well. Likewise, a good Interaction to Next Paint result does not show that a page answers the visitor’s query. Pair Core Web Vitals data with the page’s purpose and user tasks, such as reaching a contact form or comparing service details.
Make the next action specific: connect a page group’s Search Console status to its template, then prioritize changes affecting loading, responsiveness, or stability. For a stronger search experience, build a performance-focused website strategy around the pages visitors need most.
SEO Guru Houston: Houston SEO Services
SEO Guru Houston helps businesses connect organic search priorities with the pages customers use to evaluate their services. If Core Web Vitals reports reveal recurring issues across important landing pages, our professional optimization strategies can align technical performance priorities with search visibility and page goals.
That work can support a broader growth strategy. Comprehensive digital marketing and B2B campaigns help businesses pursue different acquisition goals, while a well-structured website gives visitors a clearer path to useful information and next steps.
For a focused discussion about your website’s search priorities and core web vitals optimization guide implementation, contact SEO Guru Houston.
Turn Better Page Experience Into Your Next Step
Performance work creates the most value when it supports a clear business goal. Choose a priority page, connect its technical needs to the action you want visitors to take, and keep that focus as your site evolves. A core web vitals optimization guide can frame the work, but progress depends on applying the right changes to the pages that matter to your audience.
When technical improvements need to align with broader visibility and growth objectives, SEO Guru Houston offers search engine optimization, pay-per-click advertising, and B2B marketing. These services can support different acquisition strategies while your website gives visitors a smoother path to useful information and next steps.
Bring your priorities into focus and decide what better page experience should help your business achieve. Contact SEO Guru Houston to discuss how its digital marketing services fit your goals. Keep moving forward with a site built to serve both your audience and your growth strategy.
Frequently Asked Questions
FCP vs LCP: What Is the Difference?
First Contentful Paint (FCP) records when the browser first renders visible content, such as text or an image. Largest Contentful Paint (LCP) measures when the largest visible content element appears. FCP may occur while the main image or headline is still loading. Use both measurements to narrow down delays: slow FCP points to an early rendering issue, while a later LCP may point to the primary content element.
FID vs INP: What Changed?
Interaction to Next Paint (INP) replaced First Input Delay (FID) in Google’s Core Web Vitals in March 2024. FID measured delay before the browser began processing a visitor’s first interaction. INP assesses the responsiveness of interactions across a visit, including the delay until the next visual update. For example, a quick first click doesn’t reveal whether a later filter selection takes too long to display results.
First Input Delay (FID): What Is FID?
First Input Delay measured the time between a visitor’s first interaction and the browser beginning to process it. It focused on input delay, not the full time required to update the page afterward. An ideal FID was below 100 milliseconds; 100 to 300 milliseconds needed improvement, and above 300 milliseconds was poor. FID is now a legacy metric, so use INP when evaluating current Core Web Vitals.
Largest Contentful Paint (LCP): What Is LCP?
Largest Contentful Paint measures how long the largest visible content element takes to appear after a page starts loading. That element might be a prominent heading, an image, or another large content area. LCP helps identify whether the content visitors came to see appears promptly. For example, a page may show its logo quickly but still have a slow LCP if its main banner loads later.
What Is a Good LCP Score?
A good LCP is within the first 2.5 seconds after loading begins. A score from 2.5 to 4.0 seconds needs improvement, while a score greater than 4.0 seconds is poor. If a report flags LCP, identify which element was measured before changing code. A large image, delayed server response, or render-blocking resource can each affect when that element appears.
What Does Insufficient Real User Data in PageSpeed Insights Mean?
It means PageSpeed Insights lacks enough eligible real-world Chrome user data to show field results for that page or origin. It is not a performance score and does not establish whether the page is fast or slow. Use available lab diagnostics to investigate a specific test, then review field data later as it becomes available. Test important page templates, not just the homepage.
What Are Core Web Vitals, and What Are the Current LCP, INP, and CLS Thresholds?
Core Web Vitals measure real-world loading performance, responsiveness, and visual stability. Good targets are LCP within 2.5 seconds, INP below 200 milliseconds, and CLS below 0.1. LCP above 4.0 seconds, INP above 500 milliseconds, and CLS above 0.25 are poor. The middle ranges need improvement: LCP from 2.5 to 4.0 seconds, INP from 200 to 500 milliseconds, and CLS from 0.1 to 0.25.
How Do Field Data and Lab Data Differ When Evaluating Core Web Vitals?
Field data reflects real visits from Chrome users, while lab data comes from a controlled test that helps reproduce and diagnose page behavior. Field results show how people experience a page across their actual devices and network conditions. A lab test can help isolate a slow script or image, but one test does not represent every visitor. Compare both views to connect real-world patterns with specific technical causes.

