
Tag Archives: user experience

How to Fix a High Bounce Rate by Matching Visitor Intent

What if a high bounce rate points to a mismatch, not a bad website? In GA4, bounce rate is 100% minus engagement rate, so the number needs context before it signals a problem. Learning how to fix a high bounce rate starts with looking beyond the sitewide average.

It’s frustrating to see visitors leave quickly, especially when a landing page is meant to turn interest into action. But a blog reader who finds an answer and leaves has different intent from someone arriving on a service page ready to enquire. Traffic source, page purpose, and visitor expectations all shape what a bounce rate means.

This article explains how bounce rate works, why it varies across website types and traffic segments, and how to identify pages that deserve attention. You’ll learn practical ways to improve landing-page speed, clarity, navigation, and calls to action, then align each page with what visitors came to do. The goal isn’t simply to lower a metric. It’s to make the next step relevant.

Key Takeaways

  • Interpret bounce rate in context: website type, page purpose, and visitor expectations all affect what the metric signals.
  • Compare similar pages and traffic segments to pinpoint where visitors leave and which pages need attention first.
  • Improve landing pages by addressing speed, clarity, navigation, and the relevance of the next step.
  • Match each page’s content and call to action to the reason visitors arrived, rather than chasing a lower number alone.
  • Use analytics to distinguish a genuine experience problem from a tracking issue before changing your site.

1. Landing page conversion optimization

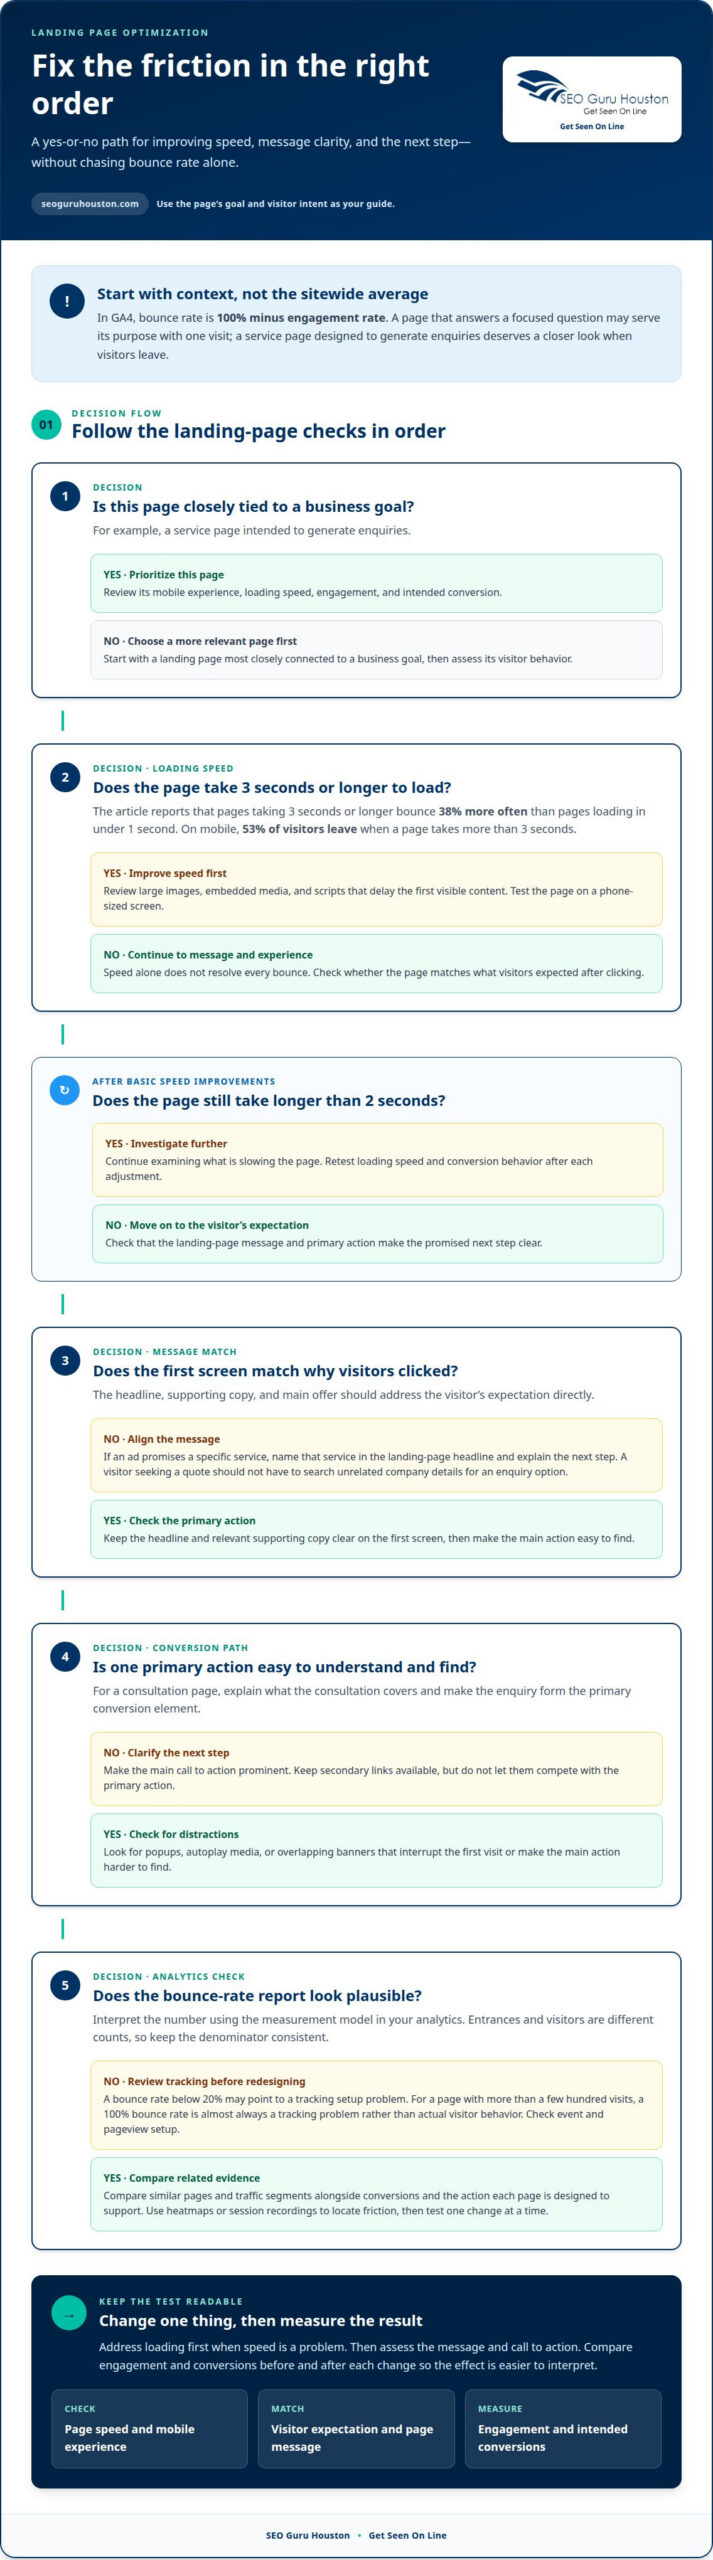
A slow landing page can lose visitors before they see the offer. Pages that take three seconds or longer to load bounce 38% more often than pages loading in under one second. On mobile, 53% of visitors leave when a page takes more than three seconds. Treat loading speed as part of conversion optimization, not a technical detail separate from engagement.

Start with the landing page most closely tied to a business goal, such as a service page designed to generate enquiries. Review its mobile experience and load speed, then make one change and measure its effect on engagement and conversions. A page that takes five seconds to load may be losing visitors. If it still takes longer than two seconds after basic speed improvements, investigate further.

  • Reduce heavy page elements. Review large images, embedded media, and scripts that delay the first visible content. For example, replace an oversized banner image with a compressed version that still communicates the offer.
  • Prioritize mobile loading. Test the landing page on a phone-sized screen. Check whether the headline, main offer, and primary action appear clearly without waiting for lower-page elements.
  • Remove distractions. Look for popups, autoplay media, or overlapping banners that interrupt the first visit. Make sure the main call to action remains easy to find.
  • Retest after each adjustment. Compare the page’s loading speed and conversion behavior before and after a change. If speed improves but visitors still leave, review the message and page experience next.

Speed alone won’t resolve every bounce. The page must also address why visitors clicked. If an ad promises a specific service, name that service in the landing-page headline and explain the next step directly. Someone looking for a quote shouldn’t have to search through unrelated company details to find an enquiry option.

Check that the first screen has a clear headline, relevant supporting copy, and one prominent action. For example, a page promoting a consultation can explain what it covers and feature an enquiry form as its primary conversion element. Keep secondary links available, but don’t let them compete with the main action.

Make each improvement deliberately. If a slow mobile landing page also has a vague offer, address loading first, then assess the message and call to action. For businesses building or refining sites across popular CMS platforms, design agencies like New Wave Digital Designs focus on streamlining page structure and user pathways to reduce early drop-offs. This sequence helps reveal which elements affect visitor behavior and keeps optimization focused on the outcome: a faster page that gives visitors a relevant answer and a clear path to conversion.

2. What is bounce rate?

Bounce rate measures visits that don’t meet a site’s definition of engagement. In Google Analytics 4 (GA4), bounce rate is 100% minus engagement rate. That means a single-page visit isn’t automatically a bounce in GA4; the session’s engagement status matters. Some analytics tools use a simpler definition, counting a visit as a bounce when someone leaves within 10 seconds.

Use the measurement model shown in your analytics before interpreting the number. For example, 500 bounces from 1,000 entrances produce a 50% bounce rate. Bounce-rate examples can vary depending on how analytics tools define and count visitors. Entrances and visitors are different counts, so keep the denominator consistent when reviewing a report.

In Google Analytics, begin with your top 20 landing pages. Compare their bounce rates with conversions, traffic sources, and the action each page is designed to support. A high rate on a page expected to generate enquiries deserves attention; a useful article may satisfy a visitor with one answer. Look for patterns across similar pages, not just the largest sitewide number.

Behavioral analytics can explain what the rate alone cannot. A heatmap can show where visitors click, how far they scroll, and whether key buttons attract attention. If visitors click an image expecting it to open but it isn’t interactive, that points to a usability gap. Session recordings can add context, while A/B testing can compare a focused change, such as a clearer button label, with the current page.

Prioritize tests based on evidence. First, identify a page with a meaningful role in traffic or conversions. Next, use heatmaps and behavior data to locate friction, such as visitors stopping before the enquiry form. Then test one change at a time and track engagement alongside the page’s intended conversion. Changing several elements together makes the results harder to interpret.

A bounce rate below 20% may point to a tracking setup problem. An analytics script firing twice can log two pageviews for one visit and distort the report. For a page with more than a few hundred visits, a 100% bounce rate is almost always a tracking problem rather than actual visitor behavior. Review event and pageview setup before redesigning the page.

Redefining a bounce can lower the reported rate quickly, but it doesn’t repair a poor experience. Keep GA4 engagement events aligned with meaningful visitor actions, then use the metric alongside clicks, conversions, and page behavior. For pages that need stronger structure, landing page development can help connect analytics findings to a clearer user journey.

3. Bounce rate benchmarks by website type

A bounce-rate benchmark helps only when the comparison is relevant. An online store, a blog, and a help center serve different purposes, so their visitors behave differently. Treat the metric as a diagnostic signal, not a universal score. A rate worth investigating on a product page may be normal on an article that answers a focused question.

Use these ranges as reference points, then compare pages with similar goals:

  • E-commerce sites: Average bounce rates range from 20% to 45%. A store can use below 45% as a target, while examining product pages separately from category pages.
  • Blogs and content sites: Average rates range from 40% to 60%, and some reach 90%. A reader may get the answer from one post without needing another page.
  • Lead-generation service sites: Average rates range from 30% to 55%. Review whether service pages make the offer and enquiry path clear.
  • Help and FAQ sites: Average rates range from 65% to 80%. Visitors may find a solution in one session and leave satisfied.

Broad benchmark tables offer another lens: 40-55% is classified as average, while 55-70% is classified as high. These labels don’t override the purpose of a page. A 60% rate may warrant closer attention on a lead-generation landing page, yet fit a support page where visitors quickly find instructions.

For non-e-commerce websites, below 60% can be considered average to good. Some people treat below 30% as evidence that a site is performing well, but a low number alone doesn’t prove strong engagement or conversions. Check whether the sessions include meaningful actions, such as form submissions or clicks on important links.

Make comparisons useful by matching page types first. Compare blog posts with other blog posts, product pages with product pages, and service pages with similar service pages. Then examine the same metric over the same reporting period and using the same analytics definition. Mixing unlike pages can hide a problem or make normal behavior look like a failure.

Separate mobile behavior during analysis, too. A landing page may attract different traffic and perform differently on mobile than on desktop. Compare each device group with similar pages, then investigate whether the content, layout, and next action suit that screen. Don’t assume the device caused the difference without reviewing the visitor journey.

Use a benchmark to decide where to investigate, not what to change automatically. If a product page sits above the e-commerce range, examine its traffic source, product information, and next step. If an FAQ page falls within its higher range, check whether visitors complete their task. The right measure reflects the page’s role and the outcome it should support.
How to Fix a High Bounce Rate by Matching Visitor Intent

4. Matching content to visitor intent

Interpret bounce rates through visitor intent, not as a verdict on page quality. Someone arriving at a blog post to answer one question may leave satisfied after reading. A visitor landing on a service page may need clearer details or a useful next step. Compare the search query, referring message, and page content to see whether they align.

On mobile, cramped text, hard-to-tap controls, confusing navigation, and intrusive pop-ups can interrupt the task and make visitors more likely to leave. Keep menus and key actions easy to use on small screens, and make pop-ups relevant and unobtrusive. A pop-up that blocks the answer before someone can read it creates friction, not engagement.

Make the first screen confirm that visitors reached the right page. For example, if a post answers a question about choosing a service, state that topic clearly in the heading and opening. Then organize supporting details in a logical order. Short paragraphs of ideally 2-4 lines help readers scan, while readable font sizes of 14-16px or even 18px support comfortable reading on modern screens.

Make the whole page easy to scan. Use descriptive subheadings, concise paragraphs, and lists for steps with a clear sequence. Someone looking for setup instructions should be able to find the relevant step without working through a dense block of text. Keep each section focused on its promise, and remove repeated details that slow readers seeking a direct answer.

Multimedia can clarify a complex idea, but it should support the text rather than get in the way. For example, a short demonstration can show how a process works, while a descriptive caption explains its relevance. Give images useful context, and avoid placing a large media element above the answer when visitors need a quick explanation. The page should remain understandable even if visitors don’t interact with the media.

Match the call to action to what the visitor has just read. A guide explaining a process can offer a related next step; a page answering a simple question may need only a relevant internal link. Avoid asking blog readers to make a high-commitment decision before they have enough context. The closer the action fits the content, the more naturally it supports the visitor’s intent.

Use scroll behavior to identify where the page stops meeting expectations. If visitors leave before reaching a key explanation, move that information higher or make the section easier to spot. A scroll-triggered pop-up appearing after about 20 minutes of reading may suit a long session better than one that interrupts the opening. Review the page’s purpose, readability, navigation, and interaction points together before changing its design.

5. Bounce rate by traffic segment

A sitewide bounce rate can hide the source of a problem. Before changing a page, segment traffic by channel, campaign, device, and audience. A landing page may satisfy search visitors but lose visitors from a paid campaign because the ad promised something different. The useful question isn’t just which page has the highest rate. It’s who arrives, what they expect, and whether the page delivers.

Start by comparing source or medium in Google Analytics. Review organic search, paid search, social, email, and referral sessions separately, then examine campaign-level results. For example, an email promoting a specific service should lead to a page that clearly explains it. If the email gets clicks but the landing page doesn’t match the offer, the mismatch may be the issue, not the audience.

Search traffic also needs a closer look. Visitors using a branded query already know the business name; non-branded searchers may be discovering a solution for the first time. BrightEdge Research estimates that 52% of clicks on non-branded queries go to the top three sites listed on search engine results pages. For that audience, a page should quickly establish relevance and answer the query that brought them there.

Compare device segments alongside traffic sources. If mobile visitors from a social campaign leave more often than desktop visitors from the same campaign, review the mobile experience and the ad’s promise. Keep the comparison focused: change one relevant element, then assess the same audience and traffic source again. Mixing desktop and mobile behavior can hide where the journey breaks.

  • Channel: Compare search, paid, social, email, and referral visits.
  • Campaign: Match each campaign’s message with its destination page.
  • Device: Separate mobile and desktop behavior within the same source.
  • Audience: Compare new and returning visitors where the reporting supports it.

Use conversion actions to assess whether a segment is valuable. A blog visitor arriving from social media may read one post and leave, while a paid-search visitor may be expected to submit an enquiry. For teams managing multi-channel campaigns, digital agencies like Web Bridge focus on aligning social media marketing content directly with on-page expectations to retain visitor interest. A higher bounce rate in the first group doesn’t automatically call for the same fix as in the second. Tie each segment to its intended outcome before prioritizing work.

In competitive categories, visitors may have five competitor websites open in other tabs while considering a purchase. Make the page’s offer, proof, and next step easy to recognize, without assuming every departure signals failure. If a specific channel consistently sends an audience to an unsuitable page, optimize that journey rather than changing the entire site. Optimize landing pages for each audience by aligning the destination with the campaign and visitor expectations.

SEO Guru Houston

SEO Guru Houston helps businesses connect bounce-rate analysis with a clearer digital marketing strategy. When traffic arrives from search or paid campaigns but landing pages don’t meet visitor expectations, professional SEO services and PPC services can help address the gap between audience intent, campaign messaging, and page content. For companies focused on reaching business buyers, specialized B2B marketing and inbound marketing strategies can support a more relevant path from discovery to engagement.

When analytics reveal patterns across channels, audiences, or landing pages, SEO Guru Houston can help coordinate a response through search optimization, paid advertising, and comprehensive website services. The aim is to find where the visitor journey breaks and align marketing activity with the experience each page delivers. Contact SEO Guru Houston to discuss your bounce-rate and visitor-intent challenges.

Turn Bounce-Rate Insights Into Your Next Move

As you learn how to fix a high bounce rate, treat visitor behavior as a guide for ongoing decisions, not a score to chase. Choose a priority audience, clarify the action its landing page should support, and use future performance to refine the experience. This keeps optimization connected to business goals.

When the challenge spans both visibility and landing-page relevance, SEO Guru Houston offers Houston SEO Services, Houston PPC Services, and Houston B2B Marketing. These offerings can help connect how people find a business with the experience they encounter after clicking. The right focus depends on where the disconnect appears in your marketing journey.

Ready to identify a practical next step for your traffic and landing pages? Talk with SEO Guru Houston about your SEO needs. Build from what your audience is telling you, and keep improving with purpose.

Frequently Asked Questions

What is bounce rate?

Bounce rate is the percentage of visits classified as unengaged under your analytics setup. In GA4, it’s the share of sessions that aren’t engaged sessions. This distinction matters: a person may read one page, find the information they need, and leave without taking another action. Interpret the metric alongside the page’s purpose, conversions, and the behavior you want visitors to complete.

What usually causes high bounce rates?

High bounce rates often point to a gap between what visitors expect and what a page delivers. A search result or ad may promise one thing while the landing page emphasizes something else. A useful starting point for how to fix a high bounce rate is to identify that mismatch. Other causes include broken forms, unclear next steps, or mobile layouts that make key content difficult to use.

How do you measure and track progress?

First define the page’s intended outcome, such as a completed enquiry form or a click to a useful resource. Then compare bounce rate with that outcome and engagement for the same landing page, traffic source, and device category. Keep analytics definitions and reporting filters consistent. If you change the page, record what you changed so you can connect later results to that adjustment.

What is a good bounce rate by industry and website type?

There’s no single target that fits every site. E-commerce averages are 20% to 45%, blogs and content sites average 40% to 60%, lead-generation service sites average 30% to 55%, and help or FAQ sites average 65% to 80%. Compare like with like, such as product pages against product pages. A useful benchmark starts an investigation; it doesn’t decide whether a page succeeds.

What are the most common causes of a high bounce rate?

Common causes include a mismatch between the traffic source and page message, confusing navigation, slow loading, intrusive pop-ups, and content that doesn’t answer the visitor’s query. A technical fault can also stop forms or buttons from working. For example, if a contact form fails after submission, visitors may leave without converting. Check the page as a visitor would, including its links and key actions.

How can I diagnose high-bounce pages using analytics and Search Console?

In analytics, identify landing pages with concerning bounce behavior, then segment results by source, campaign, device, and conversion activity. In Google Search Console, review the queries and pages attracting search impressions and clicks. Compare the need suggested by each query with the page’s title and content. If visitors click expecting an answer the page doesn’t clearly provide, revise the content or align the search result message with the destination.

How do page speed and Core Web Vitals affect bounce rate?

Slow loading can delay the content visitors came to see, while poor responsiveness or shifting page elements can make it harder to read or act. Core Web Vitals describe loading performance, interactivity, and visual stability. Review them alongside bounce behavior for the affected pages and devices. If a page feels delayed or jumps during use, address those experience issues, then assess engagement and conversions.

How can I improve landing page content and match search intent?

Start with the query, ad, or social post that brought the visitor to the page. Make the headline reflect that need, answer the main question early, and organize supporting details under clear subheadings. To learn how to fix a high bounce rate, make sure the page meets the visitor’s original expectation. For a service query, explain the service and make the relevant enquiry action easy to find.
Core Web Vitals Optimization for Faster, More Stable Pages

A page can load quickly and still frustrate visitors. The three Core Web Vitals measure loading performance with Largest Contentful Paint (LCP), responsiveness with Interaction to Next Paint (INP), and visual stability with Cumulative Layout Shift (CLS). A practical core web vitals optimization guide targets an LCP of 2.5 seconds or less, an INP below 200 milliseconds, and a CLS score below 0.1.

Those thresholds turn a vague “my site feels slow” concern into specific issues to investigate. Speed matters, but responsiveness and unexpected page movement can disrupt the experience even after content appears. Improving these signals can make important pages smoother and easier to use.

This guide explains what each metric measures, how layout shifts and delayed interactions affect visitors, and how image delivery influences loading performance. It also covers Core Web Vitals in Google Search, where they are one consideration among several, and the optimization work that can address underlying problems.

Key Takeaways

  • Understand how loading, responsiveness, and visual stability are measured, and what good performance looks like for each metric.
  • Spot common causes of layout shifts, including animations and transitions, and learn how to keep page elements stable as content loads.
  • See why Interaction to Next Paint replaced First Input Delay and what the change means for assessing real interactions.
  • Explore how image formats, sizing, and delivery affect loading speed, especially when an image is the page’s largest visible element.
  • Learn how real-user data and performance dashboards help connect Core Web Vitals improvements with page experience in Google Search.

Cumulative Layout Shift (CLS) – What is CLS?

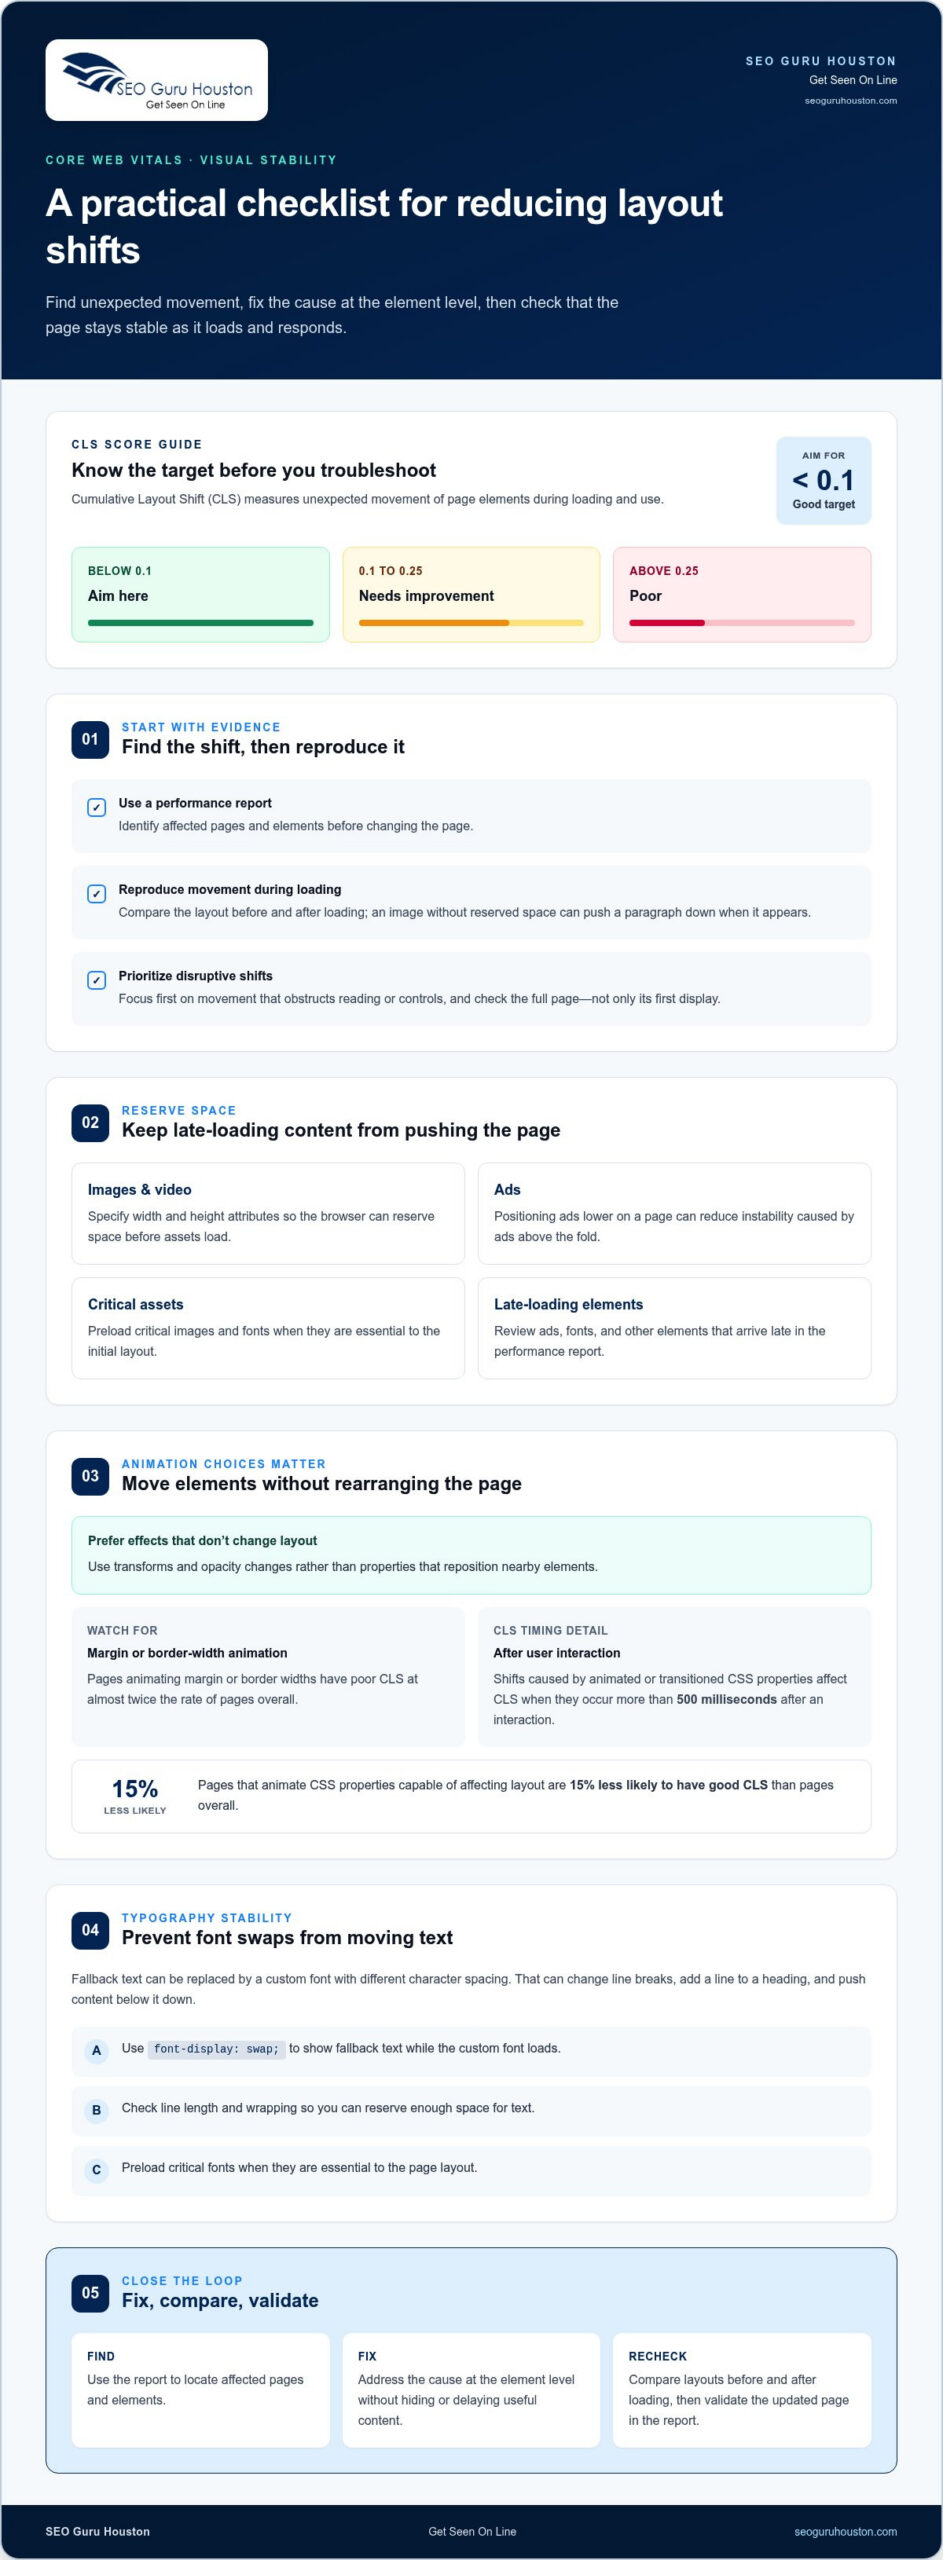
Cumulative Layout Shift (CLS) measures unexpected movement of page elements during loading and use. Aim for a CLS score below 0.1; scores from 0.1 to 0.25 need improvement, while scores above 0.25 are poor.

Animation and Transition Layout Shifts

Animation-related layout shifts happen when motion changes an element’s position or size and pushes other content around. They matter because a moving page can make visitors lose their place or click the wrong control. Layout shifts caused by animated or transitioned CSS properties affect CLS when they occur more than 500 milliseconds after a user interaction.

Choose animations that don’t change the page’s layout, such as transforms and opacity changes, instead of properties that reposition nearby elements. Pages that animate CSS properties capable of affecting layout are 15% less likely to have good CLS than pages overall. Pages animating margin or border widths have poor CLS at almost twice the rate of pages overall.

Font Loading and Layout Stability

Font loading can shift a layout if the browser first displays fallback text, then replaces it with a custom font whose characters occupy different space. That change can alter line breaks and move headings, paragraphs, and buttons. For example, a heading that wraps onto an extra line after a font swap can push the content below it down.

Use the CSS property font-display: swap; to show fallback text while a custom font loads. Check how the chosen font affects line length and wrapping so you can reserve enough space for text. Preloading critical fonts can prioritize assets essential to the page layout and help reduce movement during loading.

Cumulative Layout Shift Optimization

CLS optimization means finding unexpected movement and reducing it without hiding or delaying useful content. Start with a performance report to identify affected pages and elements, then reproduce the movement during loading. For example, an image without reserved space may push a paragraph down when it appears.

Fix the cause at the element level. Specify image and video width and height attributes so the browser can reserve space before those assets load. Positioning ads lower on a page can reduce instability caused by ads above the fold. Preload critical images and fonts when they are essential to the initial layout.

  • Reserve space for images and videos with explicit dimensions.
  • Keep animated effects from changing surrounding layout.
  • Review font swaps, ads, and other late-loading elements in the report.

Check visual stability across the page, not only on first display. A change to one element can affect nearby content, so compare the layout before and after loading. Prioritize shifts that obstruct reading or controls, then validate the updated page in the report.

What are the three Core Web Vitals metrics?

Core Web Vitals measure real-world loading performance, responsiveness, and visual stability. Largest Contentful Paint (LCP) tracks loading, Interaction to Next Paint (INP) evaluates responsiveness, and Cumulative Layout Shift (CLS) captures unexpected movement. Good targets are LCP within 2.5 seconds, INP below 200 milliseconds, and CLS below 0.1. A core web vitals optimization guide can help connect each metric to the page experience it represents.

To measure Core Web Vitals, open the report in Google Search Console to review groups of pages. Use PageSpeed Insights for page-level results and Chrome DevTools’ Performance panel to inspect a browser session. Search Console and Chrome User Experience Report data reflect real-world Chrome user experiences, while DevTools helps investigate issues in a controlled test.

The three metrics reveal different bottlenecks. A simple page may display its main content slowly if the server responds late. A page can load quickly yet feel unresponsive when JavaScript blocks the browser’s main thread. Or the layout can shift after loading, disrupting reading or interaction.

Google evaluates field performance at the 75th percentile of user experiences. That means the report reflects the slower end of real visits, not only a developer’s fastest test. The Chrome User Experience Report uses anonymized data collected from Chrome users, helping distinguish a lab-only issue from a problem visitors encounter across devices and network conditions.

PageSpeed Insights helps connect results to possible causes. Compare field data with lab diagnostics: field data reflects user experience, while a lab test provides a repeatable view of a page load. Test important templates, such as a product page and a lead form, because each may have different bottlenecks.

Performance dashboards are most useful when they track trends alongside affected page groups. In Search Console, check whether issues cluster around a template or URL type, then compare later reports after making changes. One test cannot show whether a fix improved the experience for real users.

Page builders and plugins can add scripts, styles, and requests that compete for browser time. On WordPress, review active plugins and remove unused features or scripts where safe. If TTFB stays above 400 milliseconds, address hosting before relying on frontend changes to improve LCP; a good TTFB target is below 0.8 seconds.

Shared WordPress hosting typically has a TTFB of 500 to 1500 milliseconds, compared with 100 to 300 milliseconds for managed WordPress hosting. Caching can reduce repeated server work, while a content delivery network can deliver assets to users in different locations. When template changes are needed, website development and landing page work can address the page structure behind recurring performance problems.

Interaction to Next Paint (INP): What Is It?

Interaction to Next Paint (INP) measures how quickly a page responds throughout a visitor’s interactions. A good INP is below 200 milliseconds; a score from 200 to 500 milliseconds needs improvement, and above 500 milliseconds is poor. Unlike a metric focused on one input, INP reflects the delay from interaction through the browser’s next visual update.

Google replaced First Input Delay (FID) with INP in March 2024. FID measured only the delay before a browser began processing a visitor’s first input. It did not account for later interactions or the time needed to process an event and render its visual response. INP provides a broader view by considering interactions such as clicking a menu, typing into a search field, or adding an item to a cart.

Consider a visitor selecting a filter. The browser may receive the click promptly, but a long JavaScript task can delay the filtered results appearing. INP includes that wait for the next paint. A page’s INP is 500 milliseconds if its slowest interaction takes half a second to process. This helps identify sluggish controls that a fast initial page display can conceal.

Start diagnosis by reproducing the slow interaction, then inspect the page’s main-thread work in Chrome DevTools. Browser tasks lasting more than 50 milliseconds are considered long tasks and can block responses to user actions. Look for expensive event handlers, repeated layout calculations, and scripts that run during the interaction. Break lengthy JavaScript work into smaller tasks, remove unnecessary processing, and avoid updating large sections of the page when one element changes.

Third-party scripts can compete for processing time. Review analytics, chat widgets, and advertising scripts, then load them asynchronously or limit their use where possible. For example, avoid recalculating search results on every keystroke if the interface can wait until typing pauses. Keep the response clear, such as by showing a loading state while results render.

Use real-user monitoring and the Core Web Vitals report in Search Console to identify patterns across page groups. Lab testing can help reproduce an interaction, while field data shows how visitors experience it across devices and network conditions. Prioritize the slowest meaningful interactions, then compare measurements after each code change.

Preloading helps with resources needed early, but it does not directly fix every INP problem. Prioritizing a critical script can help it arrive sooner, but competing resources can still delay interaction processing. Distinguish loading delays from JavaScript execution issues, then address the bottleneck affecting the visitor’s next action.

Core Web Vitals Optimization for Faster, More Stable Pages

Image format and responsive image optimization

For mobile users, prioritize the image that becomes the largest contentful paint element, then reduce its file size and loading delay. Serve appropriately sized images, use modern formats such as WebP, and lazy-load images outside the viewport while ensuring the primary visual is discoverable early.

Images often determine whether a mobile page feels ready. The 2024 Web Almanac reports that 73% of mobile pages have an image as their LCP element. Compress large files and serve WebP where appropriate; WebP media content is 34% smaller than the usual format. Match each image’s dimensions to its display size instead of sending a large desktop asset to a narrow screen.

Responsive image markup lets the browser choose a suitable source for the screen and layout. Use srcset to offer image variants and sizes to describe their expected display width. For example, a phone showing a small product thumbnail shouldn’t download the oversized file used for a full-width desktop banner. This reduces unnecessary data transfer.

Make the LCP image easy for the browser to discover in the initial HTML. Among pages whose LCP element was an image, 35% had image source URLs that weren’t discoverable in the initial HTML response. A further 7% obscured the LCP image behind a data-src attribute. Avoid hiding the primary image behind JavaScript-driven loading when it needs to appear early.

Prioritize images larger than 10,000 square pixels when investigating LCP. Use image preloading selectively for a critical, immediately visible visual, so the browser can request it sooner. Don’t preload every image: unnecessary requests compete for network capacity and can delay the resource that matters most.

Reserve layout space by setting image dimensions, then lazy-load below-the-fold images. Sixty-six percent of pages have at least one image without an explicit size, which can leave the browser unable to allocate space before loading. WordPress has supported native WebP images since version 5.8, and native lazy loading since version 5.5.

Image optimization is only part of resource optimization. Render-blocking CSS can delay the first display, while large JavaScript bundles and third-party scripts compete for browser time. Minify CSS and JavaScript, defer noncritical resources, and load below-the-fold images as they approach the viewport.

  • Compress images and select responsive variants for mobile display.
  • Keep the LCP image visible in initial HTML and prioritize it selectively.
  • Reserve image space and lazy-load visuals outside the viewport.

A content delivery network can serve image assets quickly to users in different locations. After changing formats, markup, or delivery, compare mobile field performance and inspect the LCP element again. This helps show whether the image itself, its discovery, or another resource is still delaying the visual result in Google Search.

The practical targets help teams decide what to fix. Aim for Largest Contentful Paint within 2.5 seconds, Interaction to Next Paint below 200 milliseconds, and Cumulative Layout Shift below 0.1. Google assesses user experiences at the 75th percentile, so a page’s fastest visit does not represent every visitor. A page that performs well only on a developer’s laptop may still struggle on slower mobile networks.

Use that percentile perspective to prioritize pages and templates. If a Search Console report groups URLs with similar performance, investigate their shared layout or components first. For example, a slow product template may affect many product pages; fixing shared image handling or scripts can address a pattern rather than one URL. Reassess field data after changes because real-world results reflect users’ devices and connections.

Keep the metrics in context. A good LCP score means the largest visible content appeared promptly; it does not prove every form or menu responds well. Likewise, a good Interaction to Next Paint result does not show that a page answers the visitor’s query. Pair Core Web Vitals data with the page’s purpose and user tasks, such as reaching a contact form or comparing service details.

Make the next action specific: connect a page group’s Search Console status to its template, then prioritize changes affecting loading, responsiveness, or stability. For a stronger search experience, build a performance-focused website strategy around the pages visitors need most.

SEO Guru Houston: Houston SEO Services

SEO Guru Houston helps businesses connect organic search priorities with the pages customers use to evaluate their services. If Core Web Vitals reports reveal recurring issues across important landing pages, our professional optimization strategies can align technical performance priorities with search visibility and page goals.

That work can support a broader growth strategy. Comprehensive digital marketing and B2B campaigns help businesses pursue different acquisition goals, while a well-structured website gives visitors a clearer path to useful information and next steps.

For a focused discussion about your website’s search priorities and core web vitals optimization guide implementation, contact SEO Guru Houston.

Turn Better Page Experience Into Your Next Step

Performance work creates the most value when it supports a clear business goal. Choose a priority page, connect its technical needs to the action you want visitors to take, and keep that focus as your site evolves. A core web vitals optimization guide can frame the work, but progress depends on applying the right changes to the pages that matter to your audience.

When technical improvements need to align with broader visibility and growth objectives, SEO Guru Houston offers search engine optimization, pay-per-click advertising, and B2B marketing. These services can support different acquisition strategies while your website gives visitors a smoother path to useful information and next steps.

Bring your priorities into focus and decide what better page experience should help your business achieve. Contact SEO Guru Houston to discuss how its digital marketing services fit your goals. Keep moving forward with a site built to serve both your audience and your growth strategy.

Frequently Asked Questions

FCP vs LCP: What Is the Difference?

First Contentful Paint (FCP) records when the browser first renders visible content, such as text or an image. Largest Contentful Paint (LCP) measures when the largest visible content element appears. FCP may occur while the main image or headline is still loading. Use both measurements to narrow down delays: slow FCP points to an early rendering issue, while a later LCP may point to the primary content element.

FID vs INP: What Changed?

Interaction to Next Paint (INP) replaced First Input Delay (FID) in Google’s Core Web Vitals in March 2024. FID measured delay before the browser began processing a visitor’s first interaction. INP assesses the responsiveness of interactions across a visit, including the delay until the next visual update. For example, a quick first click doesn’t reveal whether a later filter selection takes too long to display results.

First Input Delay (FID): What Is FID?

First Input Delay measured the time between a visitor’s first interaction and the browser beginning to process it. It focused on input delay, not the full time required to update the page afterward. An ideal FID was below 100 milliseconds; 100 to 300 milliseconds needed improvement, and above 300 milliseconds was poor. FID is now a legacy metric, so use INP when evaluating current Core Web Vitals.

Largest Contentful Paint (LCP): What Is LCP?

Largest Contentful Paint measures how long the largest visible content element takes to appear after a page starts loading. That element might be a prominent heading, an image, or another large content area. LCP helps identify whether the content visitors came to see appears promptly. For example, a page may show its logo quickly but still have a slow LCP if its main banner loads later.

What Is a Good LCP Score?

A good LCP is within the first 2.5 seconds after loading begins. A score from 2.5 to 4.0 seconds needs improvement, while a score greater than 4.0 seconds is poor. If a report flags LCP, identify which element was measured before changing code. A large image, delayed server response, or render-blocking resource can each affect when that element appears.

What Does Insufficient Real User Data in PageSpeed Insights Mean?

It means PageSpeed Insights lacks enough eligible real-world Chrome user data to show field results for that page or origin. It is not a performance score and does not establish whether the page is fast or slow. Use available lab diagnostics to investigate a specific test, then review field data later as it becomes available. Test important page templates, not just the homepage.

What Are Core Web Vitals, and What Are the Current LCP, INP, and CLS Thresholds?

Core Web Vitals measure real-world loading performance, responsiveness, and visual stability. Good targets are LCP within 2.5 seconds, INP below 200 milliseconds, and CLS below 0.1. LCP above 4.0 seconds, INP above 500 milliseconds, and CLS above 0.25 are poor. The middle ranges need improvement: LCP from 2.5 to 4.0 seconds, INP from 200 to 500 milliseconds, and CLS from 0.1 to 0.25.

How Do Field Data and Lab Data Differ When Evaluating Core Web Vitals?

Field data reflects real visits from Chrome users, while lab data comes from a controlled test that helps reproduce and diagnose page behavior. Field results show how people experience a page across their actual devices and network conditions. A lab test can help isolate a slow script or image, but one test does not represent every visitor. Compare both views to connect real-world patterns with specific technical causes.

Conversion Rate Optimization Houston: The Assertive Blueprint for 2026 Market Dominance

Conversion Rate Optimization Houston: The Assertive Blueprint for 2026 Market Dominance

If your website is currently acting as a passive digital brochure, you aren’t just losing leads; you are surrendering your market share to competitors who are hungry for your business. In a Houston market where retail occupancy has hit a record 95.2%, the digital battlefield is the only place left for aggressive, uncapped expansion. You likely feel the sting of a high cost-per-acquisition and the headache of staring at complex analytics that don’t translate to cash. We know that the average conversion rate of 2.9% is no longer enough to win. This is why professional conversion rate optimization houston is no longer an optional luxury; it’s a fundamental necessity for survival and dominance in 2026.

You deserve a website that functions as a high-performance revenue engine, not a static expense. We promise to show you exactly how to transform your digital presence into a dominant force that crushes the competition without spending an extra dime on advertising. This blueprint provides a clear, data-driven roadmap to maximize your ROI while staying compliant with the Texas Responsible AI Governance Act. We are moving beyond abstract theories to give you a sequence of logical, technical steps that turn passive visitors into measurable business growth. Get ready to stop guessing and start scaling.

Key Takeaways

  • Stop bleeding revenue by shifting your focus from vanity traffic metrics to a high-performance conversion framework that forces your website to work for you.
  • Master the psychological mechanics of friction to eliminate the cognitive load that’s currently driving your potential customers into the arms of the competition.
  • Deploy a systematic “Friction Audit” across your digital assets to identify technical and behavioral bottlenecks that are sabotaging your ROI.
  • Execute a professional strategy for conversion rate optimization houston that utilizes a repeatable 5-step cycle to turn every click into a measurable business outcome.
  • Transition from a static, “one-and-done” mindset to a continuous growth model that’s non-negotiable for achieving total market dominance in 2026.

Stop Bleeding Revenue: The Absolute Necessity of Conversion Rate Optimization

Stop treating your website like a digital business card. If you are pumping capital into search engines and social platforms only to watch visitors bounce without taking action, your marketing strategy is a financial liability. In the high-stakes Houston market of 2026, where cost-per-click rates in sectors like energy and medicine are skyrocketing, you cannot afford a leaky funnel. You need to understand what is conversion rate optimization to stop the hemorrhage. It is the systematic, data-driven process of increasing the percentage of website visitors who complete a specific goal; whether that is filling out a lead form, making a purchase, or picking up the phone.

Passive web design is for companies that are content with mediocrity. An assertive conversion strategy is for those who demand market dominance. Your website must be a high-performance revenue engine that captures interest and forces action. With Houston’s retail occupancy hitting 95.2% and digital competition becoming more surgical, simply “having a site” is a recipe for invisibility. Professional conversion rate optimization houston ensures that every dollar you spend on traffic works twice as hard for your bottom line. It transforms your digital presence from a static expense into a precision tool for aggressive growth.

The ROI of CRO: Why Every Percent Matters

Small shifts in performance create massive shifts in profit. If you increase your conversion rate from 2% to 3%, you haven’t just gained a single percentage point; you have increased your lead volume by 50% without spending an extra cent on ads. This is the power of compounding growth in a digital ecosystem. When you optimize the middle of your funnel, every subsequent marketing effort becomes more efficient and less expensive. A focused conversion rate optimization houston strategy ensures that your B2B sales cycle remains short, profitable, and resistant to market fluctuations. It’s the difference between struggling to break even and scaling with total confidence.

Conversion vs. Traffic: Breaking the Vanity Metric Trap

Traffic is a vanity metric that hides the truth about your business health. Chasing more hits is a waste of your budget if your high converting landing page design is fundamentally broken. Many Houston enterprises suffer from “Leaky Bucket” syndrome. They pour more water (traffic) into the bucket while ignoring the holes at the bottom. Don’t fall into the trap of prioritizing aesthetics over performance. A beautiful website that doesn’t convert is a failure. You need a site that prioritizes user intent and psychological triggers over abstract design trends. If your landing pages aren’t engineered for the specific goal of conversion, you are essentially subsidizing your competitors’ success by letting qualified leads slip through your fingers.

The Psychological Mechanics of High-Performance Funnels

Data tells you what your visitors are doing, but psychology tells you why they’re doing it. If you want to dominate your niche, you must master consumer psychology to understand the hidden drivers behind every click. High-performance funnels aren’t built on guesswork; they’re engineered to reduce cognitive load. Every time a user has to think too hard about your navigation or wonder what your value proposition actually is, you’ve created friction. Friction is the silent killer of ROI. In the aggressive landscape of 2026, your website must be intuitive enough to guide a prospect from curiosity to conversion without a single moment of hesitation.

We utilize the Fogg Behavior Model to drive decisive action. This framework dictates that behavior happens when motivation, ability, and a prompt converge at the same moment. If your motivation is high but the task is too difficult, you fail. If the task is easy but the motivation is low, you still fail. Deploying a rigorous strategy for conversion rate optimization houston means we align these three pillars perfectly. We amplify the user’s motivation through assertive messaging, increase their ability by removing technical hurdles, and provide the perfect prompt to close the deal. If you are ready to stop guessing, it’s time to partner with a high-performance growth strategist who understands these mechanics.

The Anatomy of a High-Converting Call to Action

Your Call to Action (CTA) shouldn’t ask for permission; it should command attention. Vague phrases like “Submit” or “Click Here” are relics of a passive era. You need assertive language that mirrors the user’s desired outcome, such as “Claim My Market Dominance” or “Secure My Growth Strategy.” Visual hierarchy is equally critical. We use color theory and spatial design to ensure the “Money Action” is the most prominent element on the screen. By layering in urgency and scarcity, such as limited-time offers or exclusive B2B insights, we force the user to act now rather than “thinking about it” later.

Leveraging Social Proof and Authority

Trust is the primary currency of the B2B world. You cannot expect a prospect to hand over their budget if they don’t view you as the undisputed authority in your field. Integrating testimonials and case studies is a baseline requirement, but the delivery matters. Static text is easily ignored. However, utilizing video marketing for business websites allows you to establish immediate, visceral trust through human connection and verified results. To truly crush the competition in 2026, your site must prominently feature certification badges and “As Seen In” sections. These aren’t just decorations; they are non-negotiable authority signals that tell your visitors you’ve already won for others, and you’ll win for them too.

Identifying the Friction: A Systematic Audit of Your Digital Assets

You can’t optimize what you don’t understand. If your conversion rates are stagnant, you have hidden friction points that are actively repelling your prospects. A “Friction Audit” isn’t a casual look at your homepage; it’s a deep, forensic investigation into every touchpoint of your user journey. We look for the exact moment interest turns into irritation. In the competitive Houston landscape, technical performance is your baseline. If your site doesn’t load instantly or fails to respond perfectly on every device, you’ve lost the battle before it even started. Baseline metrics like page speed and mobile responsiveness are no longer “features.” They are the prerequisites for conversion rate optimization houston survival.

We use heatmaps and session recordings to uncover the “hidden” journey that your analytics dashboard misses. Watching a user “rage-click” on a broken link or scroll past your primary value proposition provides the raw truth that numbers alone cannot convey. The number one conversion killer we see is confusing navigation paired with an unclear value proposition. If a visitor can’t determine what you do and how to buy it within five seconds, they’ll bounce. We perform systematic usability testing to ensure your interface is a frictionless path to the “Money Action.”

Quantitative vs. Qualitative Data: The Full Picture

Google Analytics 4 (GA4) is excellent for identifying “where” the blood is hitting the floor. We look for high-exit pages and sudden drops in the funnel to pinpoint technical failures. However, qualitative data through user surveys and feedback loops uncovers “The Why.” You need to know the specific objections preventing a lead from converting. It’s a proven reality that users often claim they want more technical specifications while their actual behavior shows they want a faster, simpler path to a consultation. Balancing these two data sets is how you build a dominant conversion rate optimization houston strategy.

Mobile-First Optimization: The Non-Negotiable Standard

Looking good on a phone isn’t enough. Your site must be optimized for mobile action. This means eliminating fat-finger errors on buttons, ensuring forms are easy to fill on small screens, and killing intrusive pop-ups that block the user’s path. Mobile friction is the fastest way to destroy your ROI. There is also a direct, aggressive relationship between mobile UX and your local seo houston success. Search engines prioritize sites that provide a seamless mobile experience. If you fail on mobile, you’re invisible in the local search results where the most motivated Houston buyers are looking for you right now.

Conversion Rate Optimization Houston: The Assertive Blueprint for 2026 Market Dominance

The Execution Phase: How to Optimize for Maximum Impact

Execution is where your strategy meets reality. If you have identified the friction points in your funnel, you are ready to deploy a systematic implementation cycle that turns data into revenue. We don’t guess; we test. The conversion rate optimization houston cycle follows five rigorous steps: Research, Hypothesis, Testing, Analysis, and Scaling. You must move through this process methodically to ensure every change is backed by statistical significance. Testing without a framework is just throwing paint at a wall; testing with a cycle is engineering a masterpiece.

Precision requires focus. You must choose between A/B testing, where you compare two versions of a single element, and Multivariate testing, which analyzes multiple variables simultaneously. For most Houston enterprises, A/B testing is the gold standard because it allows you to isolate exactly which change drove the result. If you change five things at once, you’ll never know which one actually worked. Adopt a “Winner’s Mindset” throughout this phase. Even a failed test isn’t a loss; it’s a valuable data point that narrows your path to the perfect funnel. If you want to see how this looks in practice, partner with an assertive growth coach today.

Crafting an Assertive Hypothesis

Stop saying “I think this looks better” and start saying “The data suggests this will perform better.” A strong hypothesis is the foundation of every winning test. We use a definitive formula: “By changing X into Y, we expect Z result because of [Psychological Reason].” This forces you to justify every design or copy change with logic rather than personal preference. Consider these high-impact examples for your B2B site:

  • By moving the lead form from the footer to above the fold, we expect a 15% increase in inquiries because we are reducing the physical effort required to convert.
  • By changing the headline from “Our Services” to “Explode Your Revenue in 90 Days,” we expect higher engagement because we are addressing the user’s primary desire immediately.
  • By adding a video testimonial next to the CTA, we expect a lower bounce rate because we are providing immediate social proof at the point of decision.

The Copywriting Pivot: Selling Results, Not Features

Your visitors don’t care about your “years of experience” or your “proprietary process” until they know you can solve their problem. You must pivot your copy to sell results, not features. Every sentence on your landing page must pass the “So What?” test. If you state a fact about your business, the reader should immediately understand the benefit to them. If it doesn’t add value, cut it. Your strategy as a leading seo marketing company must be paired with persuasive, assertive copy to be effective. High rankings get them to the door; high-performance copy is what makes them walk through it. Professional conversion rate optimization houston demands that your messaging is as sharp and aggressive as your technical SEO.

Scaling Your Success: Why a Growth Partner is Non-Negotiable

Market dominance isn’t a destination; it’s a relentless state of evolution. If you believe you can “finish” a website and walk away, you’re inviting your competitors to overtake you. In the 2026 Houston market, consumer behavior shifts as rapidly as the technology driving it. Professional conversion rate optimization houston is a continuous, high-stakes process of refinement and scaling. A “one-and-done” approach is a death sentence for growth. You need a partner who views your digital funnel as a living organism that requires constant precision tuning to maintain its edge. Professional conversion rate optimization houston strategies ensure your business remains agile and profitable in a landscape that punishes stagnation.

High-growth businesses cannot afford the limitations of “DIY” optimization. Playing with generic plugins or guessing at button colors is a waste of your most valuable asset: time. You need a high-performance coach who understands the intricate synergy between technical SEO, aggressive PPC management, and demand generation. SEO Guru Houston positions itself as that essential partner. We don’t just provide services; we engineer the systems that force your market share to expand. We align every click with a conversion, ensuring your ad spend isn’t just a cost but a calculated investment in dominance.

The Advantage of Professional Expertise

You are often too close to your own brand to see the friction points repelling your prospects. You’ve become blind to the gaps in your funnel that we identified earlier as “leaky buckets.” An outside perspective is essential for objective, data-driven forensics. We utilize enterprise-level analytics and specialized behavioral tools that aren’t available to the average business owner. Our professional seo services integrate CRO into the very foundation of your marketing ecosystem. We ensure that the traffic we drive is met with a landing page designed to close the deal, creating a seamless path from search results to revenue.

Ready for Transformation?

The journey from vanity traffic metrics to total market dominance requires a shift in mindset. You must move past the “passive brochure” mentality and embrace an aggressive revenue engine. The market won’t wait for you to fix your funnel. Every day you hesitate is a day your competitors are capturing the leads that should have been yours. It is time to stop the bleeding and start the scaling. Stop guessing and start scaling with SEO Guru Houston today! Your transformation from invisibility to prominence starts with a single, decisive action. Take it now.

Claim Your Digital Dominance

The time for hesitation is over. You have the blueprint to transform your website from a passive digital brochure into an aggressive revenue engine that captures every lead your competitors are currently stealing. By systematically auditing your digital assets for friction and mastering the psychological mechanics of high-performance funnels, you’re no longer just participating in the Houston market. You’re leading it. This strategy is about moving beyond vanity metrics to focus on the only number that matters: your bottom line.

Professional conversion rate optimization houston is the single most powerful lever you can pull to maximize ROI without increasing your advertising budget. Since 2017, we’ve served as results-oriented B2B marketing specialists with a high-performance coach mentality. We don’t settle for “good enough” when total market dominance is on the table. The gap between your current results and your full potential is simply a matter of technical execution and assertive strategy.

Stop bleeding revenue and dominate your market—get your assertive CRO strategy session now!

Your business is built for growth. It’s time to let your website prove it.

Frequently Asked Questions

What is a good conversion rate for a B2B website in 2026?

A strong B2B conversion rate in 2026 depends on your specific sector, but the cross-industry average sits at 2.9%. If you are in professional services, you should aim for 4.6%, while industrial sectors typically see 4.0%. Falling below these benchmarks means your competitors are likely outperforming you. Don’t settle for average results when market leaders are pushing for higher margins through aggressive optimization.

How long does it take to see results from conversion rate optimization?

You can see immediate improvements from fixing technical friction points like broken forms or slow load times. However, a comprehensive strategy for conversion rate optimization houston usually requires three to six months to gather statistically significant data. This duration allows for multiple testing cycles and psychological refinement. Patience is required for precision, but the compounding gains in your ROI make the wait a strategic necessity for growth.

Do I need a high-traffic website to perform A/B testing?

Statistical significance in A/B testing requires a healthy volume of traffic to reach a definitive winner quickly. If your traffic is lower, you should focus on heuristic audits, user recordings, and qualitative feedback instead of split testing small details. Dominating your niche doesn’t require millions of hits; it requires making every current visitor count. We prioritize high-impact changes that move the needle regardless of your current visitor count.

What is the difference between CRO and SEO?

SEO is the engine that drives qualified traffic to your site, while CRO is the mechanism that turns that traffic into revenue. One focuses on visibility and rankings; the other focuses on human behavior and psychological triggers. Achieving total market dominance requires both. Driving traffic to a site that doesn’t convert is a waste of your marketing capital. We integrate both to ensure your growth is sustainable.

How much does professional conversion rate optimization cost?

The investment for conversion rate optimization houston varies based on the complexity of your funnel and your traffic volume. High-performance agencies typically offer monthly retainers that reflect the depth of technical expertise and testing cycles required. You should view this as a strategic investment in your profit margins rather than a simple expense. A successful campaign pays for itself by lowering acquisition costs and exploding your revenue.

Can I do CRO myself or do I need an agency?

You can certainly perform basic audits yourself, but you’ll likely hit a ceiling without specialized tools and an objective, expert perspective. Most business owners are too close to their own brand to see the friction points repelling their leads. An agency provides the technical forensics and psychological insights needed for aggressive scaling. If you want to dominate your market in 2026, you need a high-performance coach who delivers measurable results.

What are the most common conversion killers on landing pages?

The most aggressive conversion killers are confusing navigation, slow load times, and vague value propositions. If a visitor can’t understand what you offer within five seconds, they’ll bounce. Excessive form fields and fat-finger errors on mobile devices also slaughter your ROI. Every extra step or bit of confusion adds friction. We eliminate these bottlenecks to ensure your funnel is a frictionless path to the money action.

How does mobile speed affect my conversion rates?

Mobile speed is a non-negotiable baseline for conversion success in 2026. A delay of even one second can cause a double-digit drop in your conversion rate. Houston buyers are impatient and expect instant results on their devices. If your site lags, you aren’t just losing a visitor; you are surrendering a lead to a faster competitor. Speed is the foundation of a high-performance user experience.