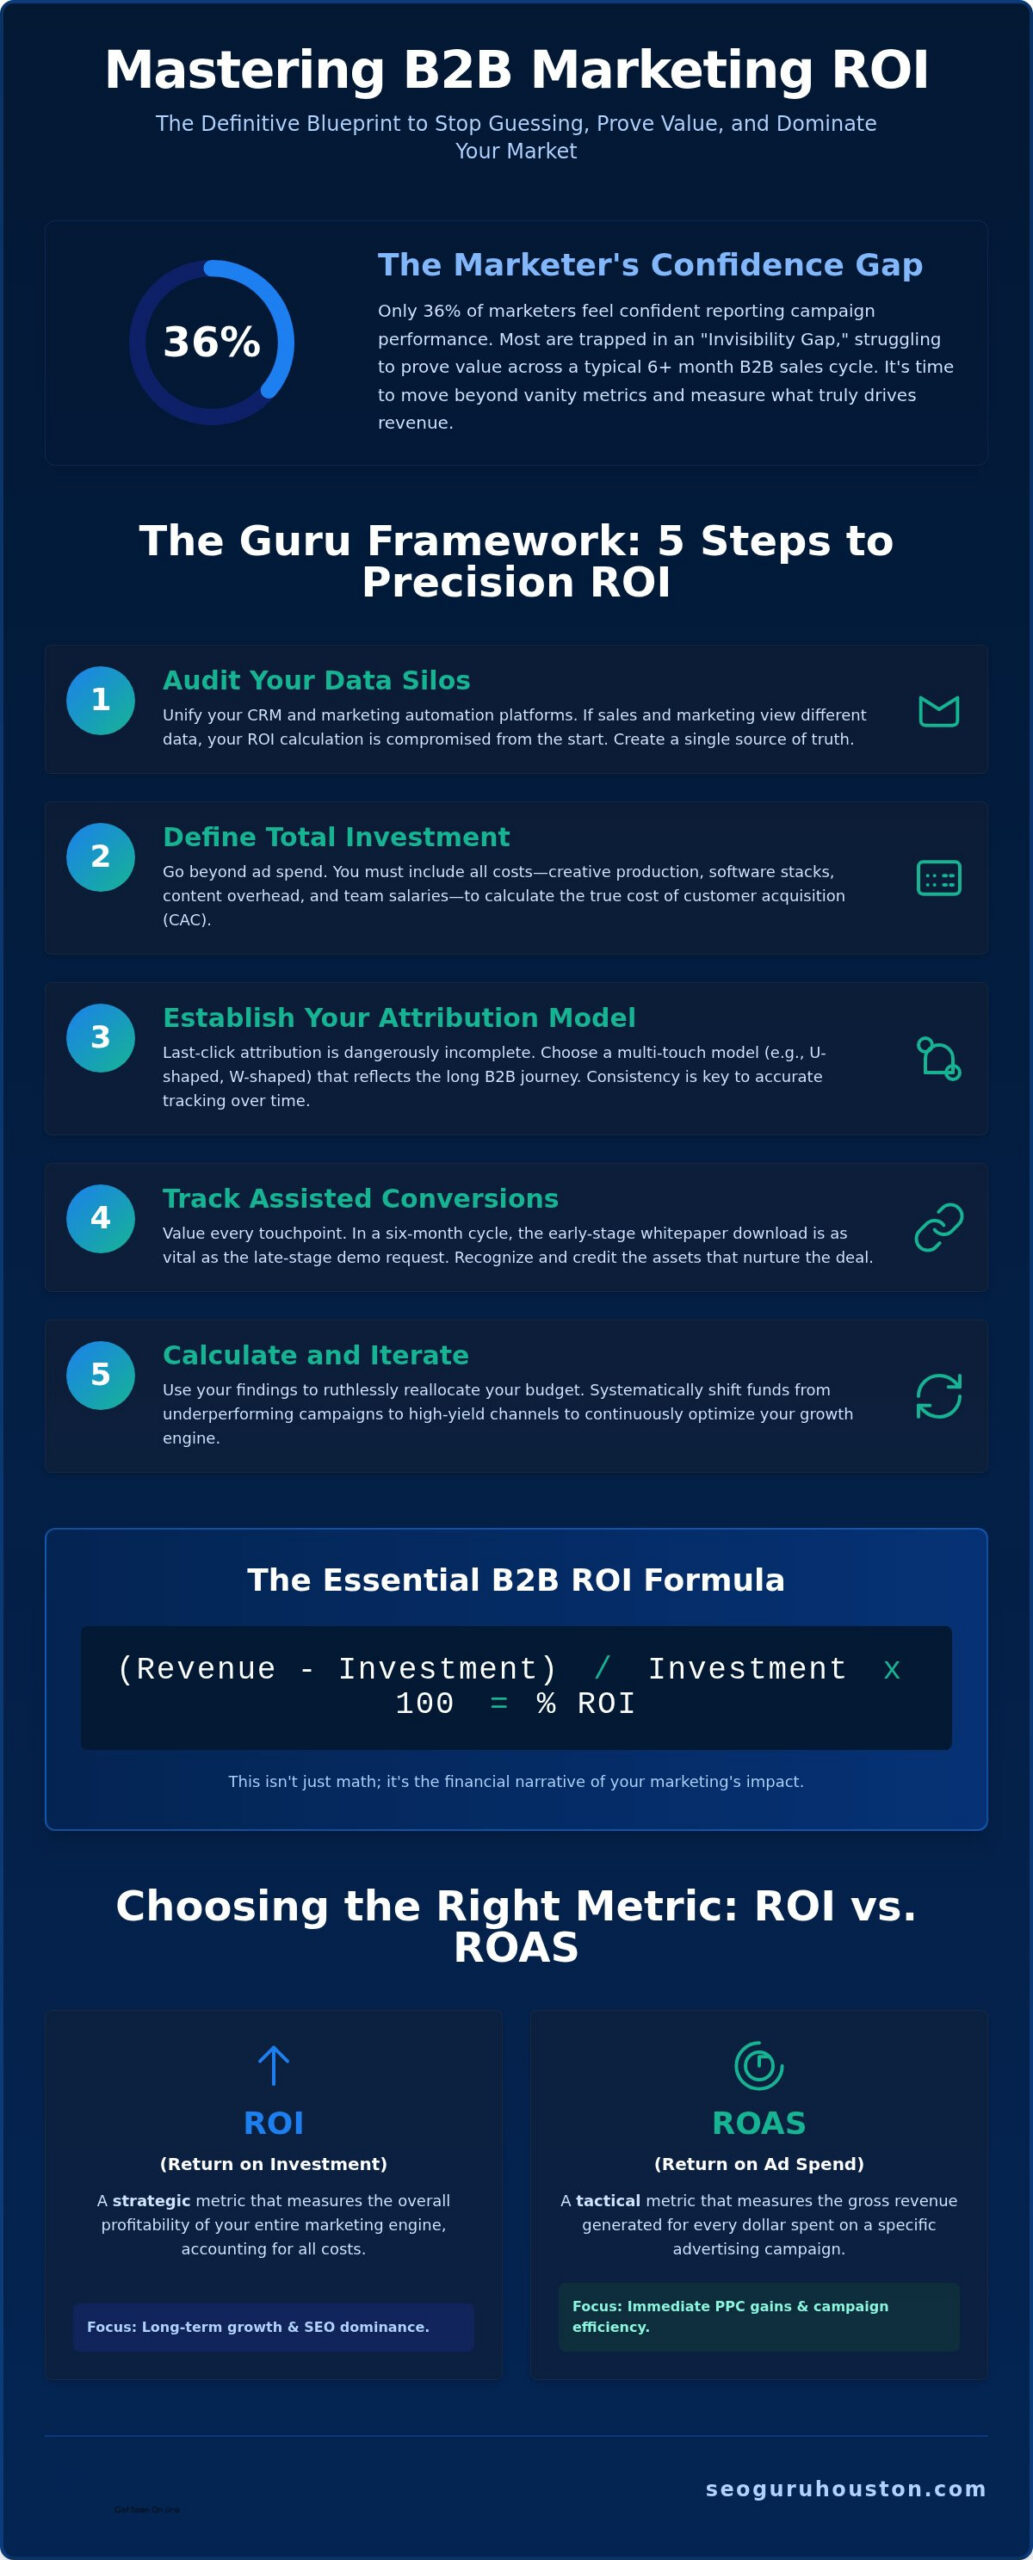
What if your monthly digital marketing report isn’t telling you whether marketing worked, but simply showing you what happened? If rows of traffic, leads, and campaign metrics feel disconnected, you’re not alone. Understanding your monthly digital marketing report means looking beyond totals to see which activity supports your business goals, where results are getting stuck, and what deserves attention next.
A useful report should make decisions clearer, not bury them under more numbers. This guide shows you how to identify metrics tied to lead generation and business outcomes, interpret changes without jumping to conclusions, and turn a monthly review into a focused plan. You’ll also see how SEO, paid advertising, and landing-page performance connect, while still needing channel-specific context. That matters when visits rise but inquiries don’t, or results across channels appear to conflict.
Use this practical approach to review performance, account for gaps in measurement, and prioritize next steps you can track. The goal is to finish each review knowing what’s working, what needs investigation, and what to change next.
Key Takeaways
- Understanding your monthly digital marketing report starts with linking each metric to a business objective, not treating every number as equally important.
- Separate visibility, engagement, conversions, lead quality, and business outcomes so sessions, clicks, and conversion rates tell a clearer story.
- Compare performance against goals and relevant periods, accounting for campaign changes, seasonality, and conversion delays.
- Turn findings into prioritized next steps by identifying likely causes, assigning ownership, and setting a clear way to review progress.
- Assess SEO, PPC, inbound marketing, and website performance together to spot disconnects and guide a coordinated strategy.
What Does a Monthly Digital Marketing Report Actually Tell You?
A monthly digital marketing report summarizes marketing activity, performance, and progress toward defined objectives over a set period. Its job isn’t simply to show whether numbers went up or down. A useful report explains what changed, which activity may have contributed, and where the business should focus next.
A report is different from a live dashboard. A dashboard displays data as it updates, giving teams a current view of activity. A monthly report reviews a defined period and interprets the data in context, so readers can assess progress, notice patterns, and decide what to investigate. Digital marketing spans multiple channels, but the report should relate each channel’s performance to the same business objectives.
Activity metrics show what marketing did; outcome metrics show what that activity helped the business achieve. Clicks, for example, can indicate that an ad attracted attention. Qualified inquiries can show whether that attention moved closer to a business result. Both measures can be useful, but they answer different questions.
What belongs in a useful monthly report?
The right contents depend on your goals, active channels, and what measurement can reliably capture. A report might include:
- An executive summary stating the main result, notable change, and priority for review.
- Goal progress showing movement toward agreed objectives, such as generating inquiries or increasing relevant website visits.
- Channel results explaining how SEO, paid advertising, or other active channels contributed, without treating their metrics as interchangeable.
- Conversions and lead context connecting website actions to inquiries and, where available, their quality or business relevance.
- Next actions identifying what to maintain, investigate, or improve in the next reporting period.
Numbers need context to be useful. The report should state the reporting dates, define key terms, and explain the comparison being used, such as the previous month or progress toward a target. If a conversion means a form submission, say so. If dates or definitions change between reports, apparent improvement or decline may reflect measurement differences rather than a real shift in performance.
Who should use the report, and how?
Different readers need different levels of detail. Owners can use the summary to assess whether marketing supports business priorities. Marketing leads can examine channel performance and decide what needs testing or adjustment. Sales teams can share whether incoming inquiries are relevant and where prospects appear to stall. Together, these perspectives connect campaign data with what happens after a lead arrives.
Start with the objective, not the dashboard’s most eye-catching metric. Ask what the business was trying to achieve, then review the relevant evidence and its limitations. A clear summary gives everyone a common starting point: what changed, why it may matter, and what decision is needed. That’s the practical core of understanding your monthly digital marketing report. It turns a review into direction, not just another meeting about numbers.
How to Read the Core Metrics in Your Monthly Marketing Report
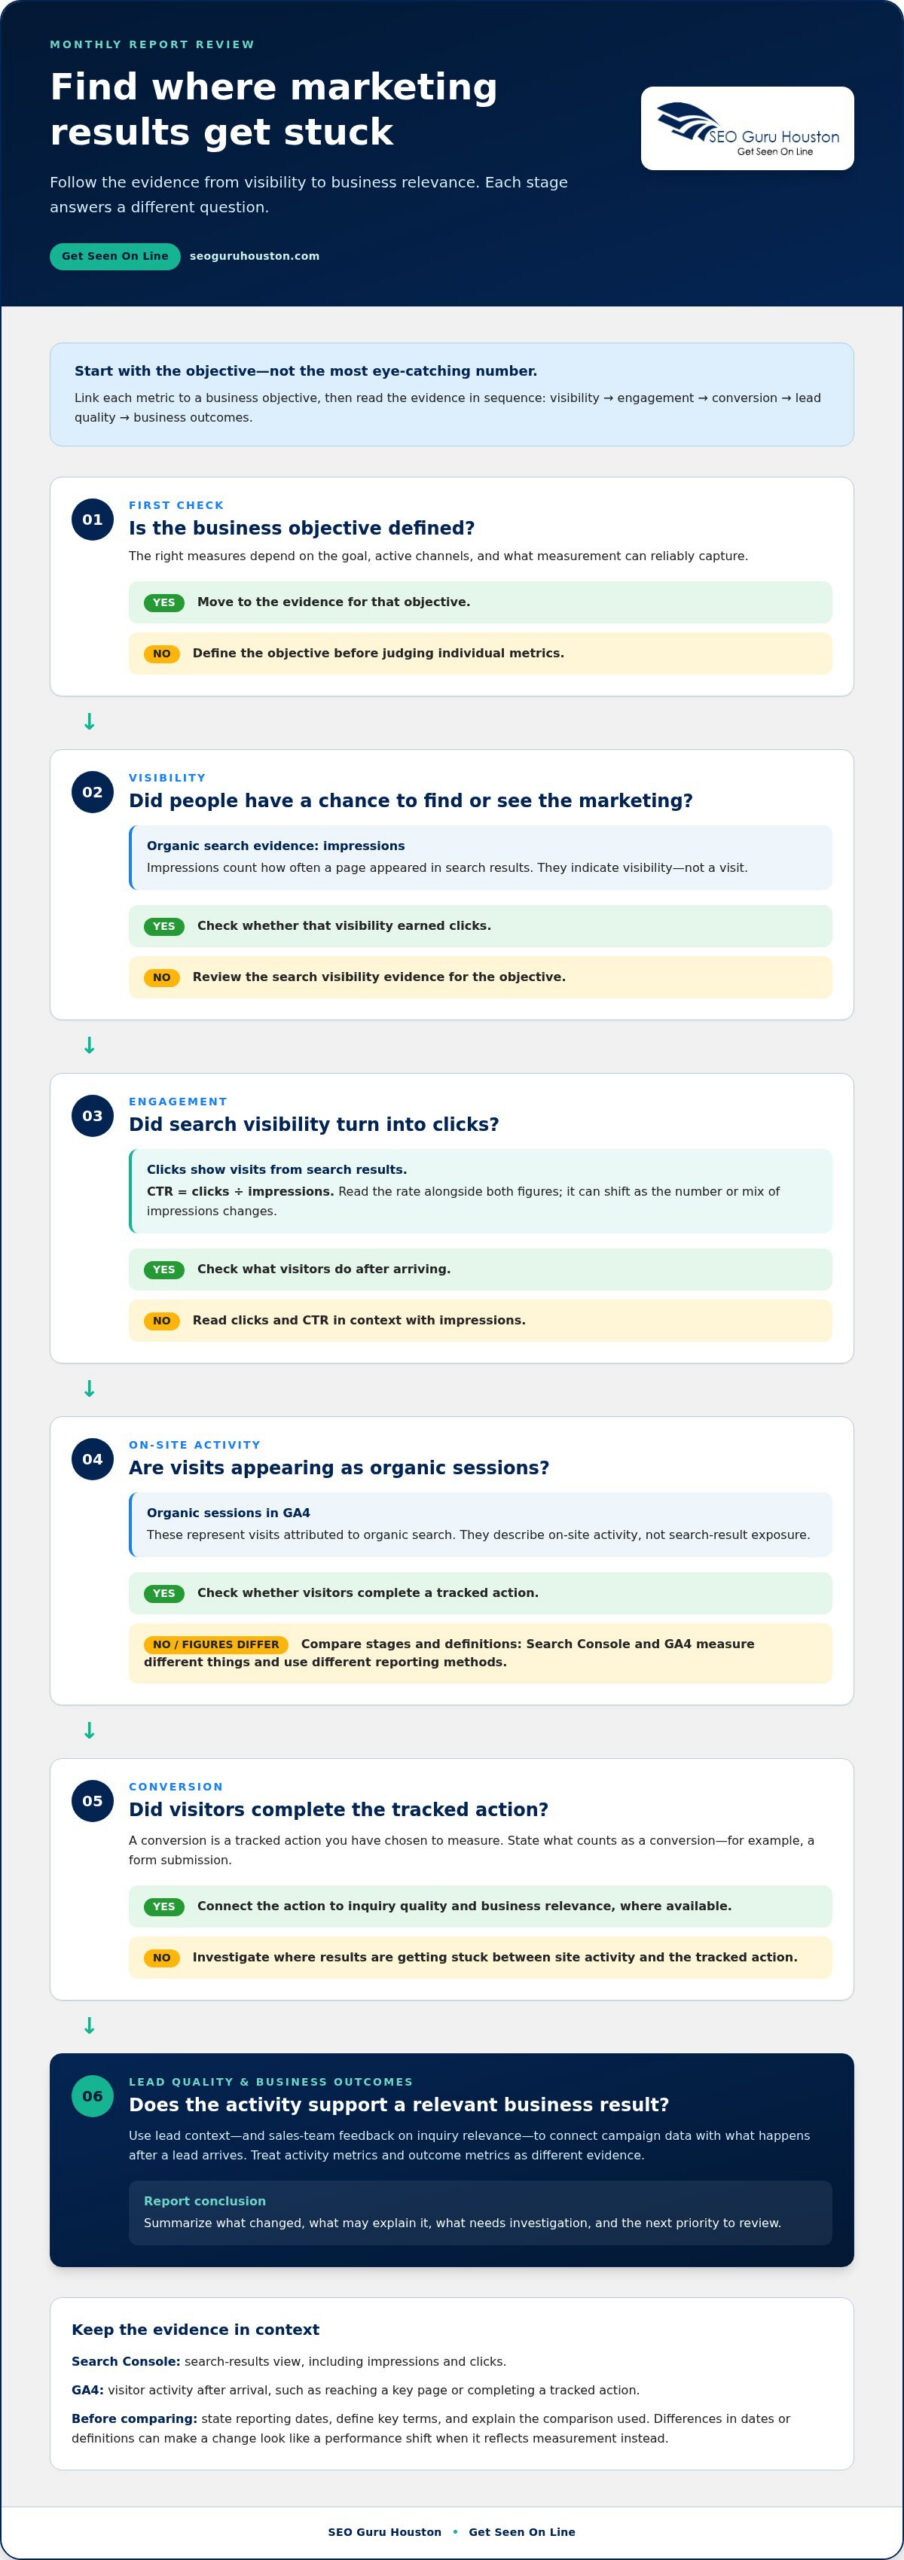
Metrics make sense as a sequence, not a scoreboard. Start with visibility: did people have a chance to find or see your marketing? Then look at engagement, conversion, lead quality, and business outcomes. Each stage answers a different question, and a change in one doesn’t automatically mean a change in the next.
A metric becomes meaningful when you connect it to a defined objective and the action you want it to explain. If the goal is to attract relevant search visitors, impressions alone won’t tell you whether people clicked or took a useful next step. If the goal is qualified inquiries, raw traffic is only an early signal.
Which SEO metrics show search visibility and engagement?
For organic search, distinguish these measures:
- Impressions count how often a page appeared in search results. They indicate visibility, not a visit.
- Clicks count visits from those search results. They show that a listing earned attention.
- Click-through rate (CTR) is clicks divided by impressions. Read it alongside both figures, since the rate can shift as the number or mix of impressions changes.
- Organic sessions in Google Analytics 4 (GA4) represent visits attributed to organic search. They describe on-site activity, not search-result exposure.
Google Search Console provides the search-results view, including impressions and clicks. GA4 shows what visitors do after they arrive, such as whether they continue to a key page or complete a tracked action. The figures may not match exactly because the tools measure different stages and use different reporting methods. Together, they help show whether visibility is turning into relevant site activity. For broader professional SEO services context, interpret search metrics against the strategy and audience the work is intended to reach.
Which paid and website metrics indicate campaign performance?
Read paid campaigns stage by stage. Ad impressions show exposure; clicks show visits generated by the ad. A conversion is a tracked action you’ve chosen to count, such as a submitted inquiry form. A conversion rate compares conversions with a defined set of interactions or visits, so check the report’s denominator before comparing rates. Cost per conversion relates advertising spend to the conversions recorded. It describes efficiency against that conversion definition, not lead quality or eventual revenue by itself.
Then examine the landing page. If ads earn clicks but visitors leave without taking the intended action, the issue may be the page experience, message match, or offer, not simply the ad. If conversions rise, check whether the inquiries are relevant and progressing toward business outcomes. Traffic growth matters only when it brings the right audience and supports meaningful action. Assess PPC management across ad delivery, landing-page behavior, and conversion quality, with each measure tied to its role in the campaign.
That’s the heart of understanding your monthly digital marketing report: follow the path from exposure to action, then test whether the action advances a business goal.
How to Judge Monthly Results Without Misreading the Numbers
A month-over-month change is a signal, not a verdict. To judge performance fairly, compare results with the stated goal, a relevant previous period, and the changes made to campaigns or the website. A rise in inquiries may look positive, but if the business goal is qualified opportunities, volume alone doesn’t show whether performance improved.
Keep comparisons consistent by using matching date ranges and the same metric definitions. Then check what changed during either period. Seasonality can affect demand; budget adjustments can alter reach; website updates may change visitor behavior; and tracking changes can shift what gets recorded. Conversions may also happen after the month in which a person first clicked or visited. Note these factors alongside the results instead of treating them as background noise.
How should you compare this month with earlier performance?
Separate short-term movement from longer-term patterns when enough comparable data exists. A single month can be affected by a campaign launch, a brief surge in demand, or a measurement issue. Note meaningful shifts in targeting, spend, landing pages, and tracking so you can distinguish a possible trend from a one-off change. Before deciding to scale, pause, or investigate, ask whether the movement aligns with the goal.
Use this framework to keep unlike measures in their proper roles:
| Metric group | What it helps you assess | What it can’t prove alone |
|---|---|---|
| Activity metrics | Marketing exposure and interaction, such as impressions, clicks, or visits | That activity produced qualified leads or sales |
| Conversion metrics | Whether visitors completed a defined action, such as submitting an inquiry | That every conversion was valuable or became a customer |
| Business outcomes | Lead quality, sales progression, or other outcomes tied to business goals | Which channel caused the outcome without further context |
What can attribution and lead quality reveal?
Attribution is a model for assigning credit to marketing touchpoints. One system may credit the last interaction before an inquiry, while another may show several interactions along the path. Totals can differ because systems use different definitions, data, and attribution rules. Treat attribution as a useful perspective, not proof that one channel caused a result. A channel may contribute earlier in the journey without receiving final credit.
Pair lead volume with the quality indicators available to your team: whether the inquiry is relevant, whether sales can progress the conversation, and whether opportunities advance. This matters in B2B marketing, where consideration may stretch across multiple interactions. Judge a B2B demand generation strategy with that longer journey in mind, rather than by a single month’s final-touch conversions.
For stronger digital marketing coordination, use the evidence to align channel activity with lead quality and sales feedback. That’s the discipline behind understanding your monthly digital marketing report: compare carefully, question what the data supports, and act on the clearest signal.
How to Turn Your Monthly Digital Marketing Report into an Action Plan
A report creates value when someone acts on what it reveals. Use a repeatable workflow to turn useful findings into owned tasks instead of letting them disappear into meeting notes. Keep the process focused: not every fluctuation deserves a change, and not every opportunity needs to be tackled at once.
- Revisit the goal. Confirm what the marketing activity was meant to support, such as relevant inquiries or stronger landing-page conversions.
- Identify meaningful changes. Look for results that matter to the goal, not simply the largest increase or decrease in the report.
- Investigate likely causes. Review campaign adjustments, audience or message changes, website experience, and tracking before deciding what the numbers mean.
- Prioritize the response. Address unreliable conversion measurement or a broken conversion path before moving to less urgent optimization ideas.
- Assign and review. Give each action an owner, a measurable indicator, and a review date. Record the result and decide whether to continue, revise, or stop the action.
This sequence turns understanding your monthly digital marketing report into a practical operating habit. It also helps the team avoid making several changes at once and losing track of which one may have influenced performance.
How do you prioritize findings and assign next steps?
Rank findings by their connection to business goals, the strength of the evidence, and how readily the team can act. A tracking error that makes conversions unreliable may need immediate attention. A possible landing-page improvement supported by limited evidence can be planned as a test. Make each action specific, assign an owner, and define how you’ll assess success.
Replace “improve the landing page” with a task someone can complete and assess, such as reviewing the form path and documenting where visitors abandon it. Name the responsible person, choose an indicator tied to the goal, and set a date to check what happened. Describe the expected signal, not a promised result. For example, the team might look for fewer form errors or a change in completed submissions, while recognizing that the outcome has to be measured.
How should teams use findings between monthly reviews?
Keep the action list active throughout the month. Check progress at agreed points, note blockers, and record campaign or website changes with their dates. That change log gives the next review context: without it, a shift in performance can be difficult to interpret or connect to work completed.
If findings point to friction in the conversion experience, assess the landing page as part of the campaign, not in isolation. Reviewing high-converting landing page design can help frame what to examine, from message alignment to the action visitors are asked to take. Coordinating SEO, PPC, and website work can also keep channel activity connected to lead generation.
A coordinated digital marketing approach can connect reporting insights with accountable next steps through integrated digital marketing support.
How Integrated Digital Marketing Services Make Reporting More Useful
A report can reveal that one channel attracts attention while another contributes to inquiries, but disconnected plans make it harder to act on that picture. Coordinated marketing gives teams a shared business objective and a clearer way to understand how channel activity fits together. SEO, PPC, inbound marketing, and website work can each play a distinct role while contributing to the same lead-generation goals.
Dashboards can organize data. They can’t decide which audience to prioritize, improve a landing page, or align a campaign with sales needs. That takes interpretation and execution. Understanding your monthly digital marketing report becomes more valuable when findings inform a strategy and the strategy shapes what the team does next.
When do disconnected channels make reports harder to act on?
If SEO is measured mainly by organic visits, PPC by clicks, and the website by form submissions, each channel may appear to have a separate definition of success. That makes it difficult to see how a potential customer moves from discovering a business to making an inquiry. Align channel-specific indicators with a shared lead or revenue goal to create a more useful view, without pretending every channel contributes in the same way. A coordinated B2B inbound marketing approach can help frame how useful content, visibility, and follow-up support longer buyer journeys.
For example, search visibility may bring a prospective customer to a service page, while paid advertising may reach another audience with a specific offer. The website and landing pages shape what visitors can do next. Reviewing these activities together can reveal where the journey is losing momentum, while channel-level context helps teams choose an appropriate response.
The agency provides SEO and PPC services designed to improve visibility and attract relevant traffic, alongside B2B and inbound marketing, website development, and landing page design. The right combination depends on the business objective and the gaps the reporting reveals. A report can help clarify those needs, but it doesn’t replace a deliberate plan.
What should a useful marketing partnership deliver?
A useful partnership starts with clear goals and reporting that explains what the measures mean. It connects results to context, interprets what the evidence suggests, and identifies prioritized recommendations. SEO and PPC decisions should be grounded in available performance data, while website and landing-page work should be considered when the visitor experience appears to limit progress. No dashboard or channel guarantees a particular outcome.
Look for a working process that keeps goals, measurement, and execution connected. Teams should be able to understand what changed, why it matters, who owns the next step, and how progress will be assessed. That’s how reporting becomes more than a monthly recap. It becomes a practical input to coordinated marketing decisions.
Explore digital marketing services to connect reporting insights with a coordinated strategy and identify a next step that aligns with your business goals.
Make Your Next Marketing Decision Count
Let each reporting cycle sharpen the questions you ask, not just document what has already happened. What should the next period teach you about your audience, your message, or the path from first visit to inquiry? Carry one clear learning goal into the next cycle, then use the evidence to refine your strategy. That’s how understanding your monthly digital marketing report becomes an ongoing advantage rather than a monthly task.
When findings point to gaps between visibility and action, connect the work behind those stages. SEO and PPC can support visibility and relevant traffic, while website development and landing page design integrated with demand generation can align the visitor experience with business goals. The right next move depends on what your reporting reveals.
Ready to turn marketing insights into coordinated execution? Explore digital marketing services and take the next step with a clearer direction. Keep asking sharper questions, learning from the evidence, and moving your marketing forward.
Frequently Asked Questions
Is one month of marketing data enough to judge campaign success?
Usually, one month is a useful checkpoint, not enough evidence for a final verdict. A small number of inquiries can make a conversion rate swing sharply, and a short reporting window may miss leads that are still progressing. Use the month to catch clear problems, such as a broken form, then assess performance over a longer, comparable period before making major strategic changes.
Can Google Analytics 4 and an advertising platform show different conversion totals?
Yes. The systems may count different actions, use different attribution rules, or assign conversions to different dates. For example, an ad platform may credit a conversion to an ad interaction, while Google Analytics 4 (GA4) reports it according to its configured event and attribution setup. Check that both tools use the same conversion definition and date range before treating a gap as a tracking error.
What is a good conversion rate for a digital marketing campaign?
There isn’t one conversion rate that’s good for every campaign. A rate depends on what counts as a conversion, the audience, channel, offer, and visitor intent. A newsletter signup and a qualified sales inquiry represent different levels of value. Define the action that matters, then compare the rate with your own historical performance and lead quality. A higher rate isn’t automatically better if the leads are less relevant.
How long can SEO take to show measurable movement in a monthly report?
SEO timing varies with the site’s starting point, competition, technical condition, and the work being done, so a fixed timetable can mislead. Look for relevant indicators at different stages: whether important pages are indexed, whether search impressions or clicks are changing, and whether organic visitors take useful actions. If a page has little search visibility, first check whether it can be crawled and indexed before judging its content performance.
Should every business use the same digital marketing metrics?
No. Choose metrics based on the business model and the decision the report needs to support. An online store may track completed purchases and average order value, while a B2B firm may focus on qualified inquiries and sales progression. A metric that helps one team allocate budget may distract another. Keep a stable core for comparison, then add channel or business-specific measures where they answer a distinct question.
Can a monthly report prove that marketing caused a sale?
A report can show evidence that marketing touchpoints preceded or assisted a sale, but it rarely proves that a single campaign caused it. Buyers may encounter several channels, speak with sales, and return later through a different route. Combine analytics with customer and sales records, and treat attribution as one view of the journey. Stronger causal evidence generally requires a carefully designed experiment or comparison.
How often should a team review performance between monthly reports?
Set a check-in rhythm that matches campaign activity and the speed of decisions. A brief weekly review can help catch tracking failures, unusual spend, or sudden drops in form submissions; deeper strategic evaluation can remain monthly. Avoid reacting to every daily fluctuation. Record significant changes as they happen, and make sure someone owns follow-up so urgent issues don’t wait for the next scheduled report.