
What if a high bounce rate points to a mismatch, not a bad website? In GA4, bounce rate is 100% minus engagement rate, so the number needs context before it signals a problem. Learning how to fix a high bounce rate starts with looking beyond the sitewide average.
It’s frustrating to see visitors leave quickly, especially when a landing page is meant to turn interest into action. But a blog reader who finds an answer and leaves has different intent from someone arriving on a service page ready to enquire. Traffic source, page purpose, and visitor expectations all shape what a bounce rate means.
This article explains how bounce rate works, why it varies across website types and traffic segments, and how to identify pages that deserve attention. You’ll learn practical ways to improve landing-page speed, clarity, navigation, and calls to action, then align each page with what visitors came to do. The goal isn’t simply to lower a metric. It’s to make the next step relevant.
Key Takeaways
- Interpret bounce rate in context: website type, page purpose, and visitor expectations all affect what the metric signals.
- Compare similar pages and traffic segments to pinpoint where visitors leave and which pages need attention first.
- Improve landing pages by addressing speed, clarity, navigation, and the relevance of the next step.
- Match each page’s content and call to action to the reason visitors arrived, rather than chasing a lower number alone.
- Use analytics to distinguish a genuine experience problem from a tracking issue before changing your site.
1. Landing page conversion optimization
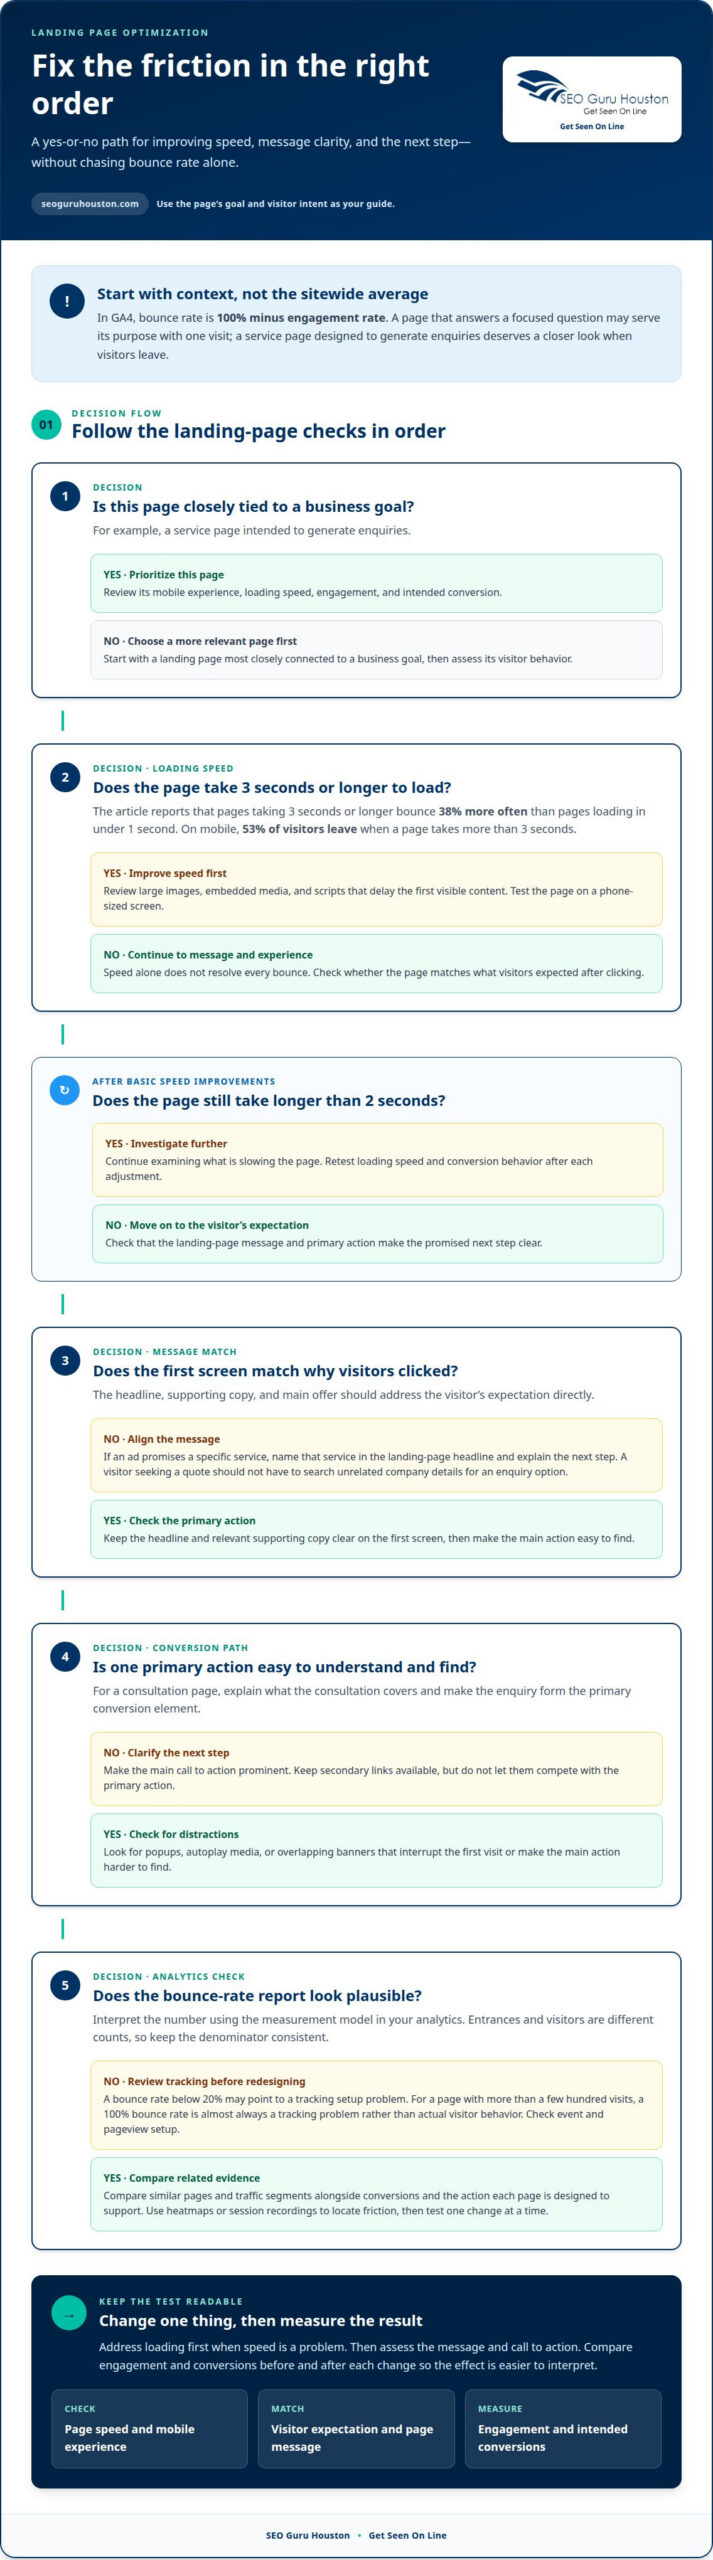
A slow landing page can lose visitors before they see the offer. Pages that take three seconds or longer to load bounce 38% more often than pages loading in under one second. On mobile, 53% of visitors leave when a page takes more than three seconds. Treat loading speed as part of conversion optimization, not a technical detail separate from engagement.
Start with the landing page most closely tied to a business goal, such as a service page designed to generate enquiries. Review its mobile experience and load speed, then make one change and measure its effect on engagement and conversions. A page that takes five seconds to load may be losing visitors. If it still takes longer than two seconds after basic speed improvements, investigate further.
- Reduce heavy page elements. Review large images, embedded media, and scripts that delay the first visible content. For example, replace an oversized banner image with a compressed version that still communicates the offer.
- Prioritize mobile loading. Test the landing page on a phone-sized screen. Check whether the headline, main offer, and primary action appear clearly without waiting for lower-page elements.
- Remove distractions. Look for popups, autoplay media, or overlapping banners that interrupt the first visit. Make sure the main call to action remains easy to find.
- Retest after each adjustment. Compare the page’s loading speed and conversion behavior before and after a change. If speed improves but visitors still leave, review the message and page experience next.
Speed alone won’t resolve every bounce. The page must also address why visitors clicked. If an ad promises a specific service, name that service in the landing-page headline and explain the next step directly. Someone looking for a quote shouldn’t have to search through unrelated company details to find an enquiry option.
Check that the first screen has a clear headline, relevant supporting copy, and one prominent action. For example, a page promoting a consultation can explain what it covers and feature an enquiry form as its primary conversion element. Keep secondary links available, but don’t let them compete with the main action.
Make each improvement deliberately. If a slow mobile landing page also has a vague offer, address loading first, then assess the message and call to action. For businesses building or refining sites across popular CMS platforms, design agencies like New Wave Digital Designs focus on streamlining page structure and user pathways to reduce early drop-offs. This sequence helps reveal which elements affect visitor behavior and keeps optimization focused on the outcome: a faster page that gives visitors a relevant answer and a clear path to conversion.
2. What is bounce rate?
Bounce rate measures visits that don’t meet a site’s definition of engagement. In Google Analytics 4 (GA4), bounce rate is 100% minus engagement rate. That means a single-page visit isn’t automatically a bounce in GA4; the session’s engagement status matters. Some analytics tools use a simpler definition, counting a visit as a bounce when someone leaves within 10 seconds.
Use the measurement model shown in your analytics before interpreting the number. For example, 500 bounces from 1,000 entrances produce a 50% bounce rate. Bounce-rate examples can vary depending on how analytics tools define and count visitors. Entrances and visitors are different counts, so keep the denominator consistent when reviewing a report.
In Google Analytics, begin with your top 20 landing pages. Compare their bounce rates with conversions, traffic sources, and the action each page is designed to support. A high rate on a page expected to generate enquiries deserves attention; a useful article may satisfy a visitor with one answer. Look for patterns across similar pages, not just the largest sitewide number.
Behavioral analytics can explain what the rate alone cannot. A heatmap can show where visitors click, how far they scroll, and whether key buttons attract attention. If visitors click an image expecting it to open but it isn’t interactive, that points to a usability gap. Session recordings can add context, while A/B testing can compare a focused change, such as a clearer button label, with the current page.
Prioritize tests based on evidence. First, identify a page with a meaningful role in traffic or conversions. Next, use heatmaps and behavior data to locate friction, such as visitors stopping before the enquiry form. Then test one change at a time and track engagement alongside the page’s intended conversion. Changing several elements together makes the results harder to interpret.
A bounce rate below 20% may point to a tracking setup problem. An analytics script firing twice can log two pageviews for one visit and distort the report. For a page with more than a few hundred visits, a 100% bounce rate is almost always a tracking problem rather than actual visitor behavior. Review event and pageview setup before redesigning the page.
Redefining a bounce can lower the reported rate quickly, but it doesn’t repair a poor experience. Keep GA4 engagement events aligned with meaningful visitor actions, then use the metric alongside clicks, conversions, and page behavior. For pages that need stronger structure, landing page development can help connect analytics findings to a clearer user journey.
3. Bounce rate benchmarks by website type
A bounce-rate benchmark helps only when the comparison is relevant. An online store, a blog, and a help center serve different purposes, so their visitors behave differently. Treat the metric as a diagnostic signal, not a universal score. A rate worth investigating on a product page may be normal on an article that answers a focused question.
Use these ranges as reference points, then compare pages with similar goals:
- E-commerce sites: Average bounce rates range from 20% to 45%. A store can use below 45% as a target, while examining product pages separately from category pages.
- Blogs and content sites: Average rates range from 40% to 60%, and some reach 90%. A reader may get the answer from one post without needing another page.
- Lead-generation service sites: Average rates range from 30% to 55%. Review whether service pages make the offer and enquiry path clear.
- Help and FAQ sites: Average rates range from 65% to 80%. Visitors may find a solution in one session and leave satisfied.
Broad benchmark tables offer another lens: 40-55% is classified as average, while 55-70% is classified as high. These labels don’t override the purpose of a page. A 60% rate may warrant closer attention on a lead-generation landing page, yet fit a support page where visitors quickly find instructions.
For non-e-commerce websites, below 60% can be considered average to good. Some people treat below 30% as evidence that a site is performing well, but a low number alone doesn’t prove strong engagement or conversions. Check whether the sessions include meaningful actions, such as form submissions or clicks on important links.
Make comparisons useful by matching page types first. Compare blog posts with other blog posts, product pages with product pages, and service pages with similar service pages. Then examine the same metric over the same reporting period and using the same analytics definition. Mixing unlike pages can hide a problem or make normal behavior look like a failure.
Separate mobile behavior during analysis, too. A landing page may attract different traffic and perform differently on mobile than on desktop. Compare each device group with similar pages, then investigate whether the content, layout, and next action suit that screen. Don’t assume the device caused the difference without reviewing the visitor journey.
Use a benchmark to decide where to investigate, not what to change automatically. If a product page sits above the e-commerce range, examine its traffic source, product information, and next step. If an FAQ page falls within its higher range, check whether visitors complete their task. The right measure reflects the page’s role and the outcome it should support.
4. Matching content to visitor intent
Interpret bounce rates through visitor intent, not as a verdict on page quality. Someone arriving at a blog post to answer one question may leave satisfied after reading. A visitor landing on a service page may need clearer details or a useful next step. Compare the search query, referring message, and page content to see whether they align.
On mobile, cramped text, hard-to-tap controls, confusing navigation, and intrusive pop-ups can interrupt the task and make visitors more likely to leave. Keep menus and key actions easy to use on small screens, and make pop-ups relevant and unobtrusive. A pop-up that blocks the answer before someone can read it creates friction, not engagement.
Make the first screen confirm that visitors reached the right page. For example, if a post answers a question about choosing a service, state that topic clearly in the heading and opening. Then organize supporting details in a logical order. Short paragraphs of ideally 2-4 lines help readers scan, while readable font sizes of 14-16px or even 18px support comfortable reading on modern screens.
Make the whole page easy to scan. Use descriptive subheadings, concise paragraphs, and lists for steps with a clear sequence. Someone looking for setup instructions should be able to find the relevant step without working through a dense block of text. Keep each section focused on its promise, and remove repeated details that slow readers seeking a direct answer.
Multimedia can clarify a complex idea, but it should support the text rather than get in the way. For example, a short demonstration can show how a process works, while a descriptive caption explains its relevance. Give images useful context, and avoid placing a large media element above the answer when visitors need a quick explanation. The page should remain understandable even if visitors don’t interact with the media.
Match the call to action to what the visitor has just read. A guide explaining a process can offer a related next step; a page answering a simple question may need only a relevant internal link. Avoid asking blog readers to make a high-commitment decision before they have enough context. The closer the action fits the content, the more naturally it supports the visitor’s intent.
Use scroll behavior to identify where the page stops meeting expectations. If visitors leave before reaching a key explanation, move that information higher or make the section easier to spot. A scroll-triggered pop-up appearing after about 20 minutes of reading may suit a long session better than one that interrupts the opening. Review the page’s purpose, readability, navigation, and interaction points together before changing its design.
5. Bounce rate by traffic segment
A sitewide bounce rate can hide the source of a problem. Before changing a page, segment traffic by channel, campaign, device, and audience. A landing page may satisfy search visitors but lose visitors from a paid campaign because the ad promised something different. The useful question isn’t just which page has the highest rate. It’s who arrives, what they expect, and whether the page delivers.
Start by comparing source or medium in Google Analytics. Review organic search, paid search, social, email, and referral sessions separately, then examine campaign-level results. For example, an email promoting a specific service should lead to a page that clearly explains it. If the email gets clicks but the landing page doesn’t match the offer, the mismatch may be the issue, not the audience.
Search traffic also needs a closer look. Visitors using a branded query already know the business name; non-branded searchers may be discovering a solution for the first time. BrightEdge Research estimates that 52% of clicks on non-branded queries go to the top three sites listed on search engine results pages. For that audience, a page should quickly establish relevance and answer the query that brought them there.
Compare device segments alongside traffic sources. If mobile visitors from a social campaign leave more often than desktop visitors from the same campaign, review the mobile experience and the ad’s promise. Keep the comparison focused: change one relevant element, then assess the same audience and traffic source again. Mixing desktop and mobile behavior can hide where the journey breaks.
- Channel: Compare search, paid, social, email, and referral visits.
- Campaign: Match each campaign’s message with its destination page.
- Device: Separate mobile and desktop behavior within the same source.
- Audience: Compare new and returning visitors where the reporting supports it.
Use conversion actions to assess whether a segment is valuable. A blog visitor arriving from social media may read one post and leave, while a paid-search visitor may be expected to submit an enquiry. For teams managing multi-channel campaigns, digital agencies like Web Bridge focus on aligning social media marketing content directly with on-page expectations to retain visitor interest. A higher bounce rate in the first group doesn’t automatically call for the same fix as in the second. Tie each segment to its intended outcome before prioritizing work.
In competitive categories, visitors may have five competitor websites open in other tabs while considering a purchase. Make the page’s offer, proof, and next step easy to recognize, without assuming every departure signals failure. If a specific channel consistently sends an audience to an unsuitable page, optimize that journey rather than changing the entire site. Optimize landing pages for each audience by aligning the destination with the campaign and visitor expectations.
SEO Guru Houston
SEO Guru Houston helps businesses connect bounce-rate analysis with a clearer digital marketing strategy. When traffic arrives from search or paid campaigns but landing pages don’t meet visitor expectations, professional SEO services and PPC services can help address the gap between audience intent, campaign messaging, and page content. For companies focused on reaching business buyers, specialized B2B marketing and inbound marketing strategies can support a more relevant path from discovery to engagement.
When analytics reveal patterns across channels, audiences, or landing pages, SEO Guru Houston can help coordinate a response through search optimization, paid advertising, and comprehensive website services. The aim is to find where the visitor journey breaks and align marketing activity with the experience each page delivers. Contact SEO Guru Houston to discuss your bounce-rate and visitor-intent challenges.
Turn Bounce-Rate Insights Into Your Next Move
As you learn how to fix a high bounce rate, treat visitor behavior as a guide for ongoing decisions, not a score to chase. Choose a priority audience, clarify the action its landing page should support, and use future performance to refine the experience. This keeps optimization connected to business goals.
When the challenge spans both visibility and landing-page relevance, SEO Guru Houston offers Houston SEO Services, Houston PPC Services, and Houston B2B Marketing. These offerings can help connect how people find a business with the experience they encounter after clicking. The right focus depends on where the disconnect appears in your marketing journey.
Ready to identify a practical next step for your traffic and landing pages? Talk with SEO Guru Houston about your SEO needs. Build from what your audience is telling you, and keep improving with purpose.
Frequently Asked Questions
What is bounce rate?
Bounce rate is the percentage of visits classified as unengaged under your analytics setup. In GA4, it’s the share of sessions that aren’t engaged sessions. This distinction matters: a person may read one page, find the information they need, and leave without taking another action. Interpret the metric alongside the page’s purpose, conversions, and the behavior you want visitors to complete.
What usually causes high bounce rates?
High bounce rates often point to a gap between what visitors expect and what a page delivers. A search result or ad may promise one thing while the landing page emphasizes something else. A useful starting point for how to fix a high bounce rate is to identify that mismatch. Other causes include broken forms, unclear next steps, or mobile layouts that make key content difficult to use.
How do you measure and track progress?
First define the page’s intended outcome, such as a completed enquiry form or a click to a useful resource. Then compare bounce rate with that outcome and engagement for the same landing page, traffic source, and device category. Keep analytics definitions and reporting filters consistent. If you change the page, record what you changed so you can connect later results to that adjustment.
What is a good bounce rate by industry and website type?
There’s no single target that fits every site. E-commerce averages are 20% to 45%, blogs and content sites average 40% to 60%, lead-generation service sites average 30% to 55%, and help or FAQ sites average 65% to 80%. Compare like with like, such as product pages against product pages. A useful benchmark starts an investigation; it doesn’t decide whether a page succeeds.
What are the most common causes of a high bounce rate?
Common causes include a mismatch between the traffic source and page message, confusing navigation, slow loading, intrusive pop-ups, and content that doesn’t answer the visitor’s query. A technical fault can also stop forms or buttons from working. For example, if a contact form fails after submission, visitors may leave without converting. Check the page as a visitor would, including its links and key actions.
How can I diagnose high-bounce pages using analytics and Search Console?
In analytics, identify landing pages with concerning bounce behavior, then segment results by source, campaign, device, and conversion activity. In Google Search Console, review the queries and pages attracting search impressions and clicks. Compare the need suggested by each query with the page’s title and content. If visitors click expecting an answer the page doesn’t clearly provide, revise the content or align the search result message with the destination.
How do page speed and Core Web Vitals affect bounce rate?
Slow loading can delay the content visitors came to see, while poor responsiveness or shifting page elements can make it harder to read or act. Core Web Vitals describe loading performance, interactivity, and visual stability. Review them alongside bounce behavior for the affected pages and devices. If a page feels delayed or jumps during use, address those experience issues, then assess engagement and conversions.
How can I improve landing page content and match search intent?
Start with the query, ad, or social post that brought the visitor to the page. Make the headline reflect that need, answer the main question early, and organize supporting details under clear subheadings. To learn how to fix a high bounce rate, make sure the page meets the visitor’s original expectation. For a service query, explain the service and make the relevant enquiry action easy to find.

